UNITED STATES
SECURITIES AND EXCHANGE COMMISSION
WASHINGTON, D.C. 20549
FORM 10-K
(Mark one)
| ANNUAL REPORT PURSUANT TO SECTION 13 OR 15(d) OF THE SECURITIES EXCHANGE ACT OF 1934 | |||||
For the fiscal year ended December 31 , 2024
OR
| TRANSITION REPORT PURSUANT TO SECTION 13 OR 15(d) OF THE SECURITIES EXCHANGE ACT OF 1934 | |||||
For the transition period from ___________ to ______________
COMMISSION FILE NUMBER 1-16483

(Exact name of registrant as specified in its charter)
(State or other jurisdiction of incorporation or organization) | (I.R.S. Employer Identification No.) | |||||||
| (Address of principal executive offices) | (Zip Code) | |||||||
Registrant’s telephone number, including area code: 847 -943-4000
Securities registered pursuant to Section 12(b) of the Act:
| Title of each class | Trading Symbol(s) | Name of each exchange on which registered | ||||||||||||
Securities registered pursuant to Section 12(g) of the Act: None
Indicate by check mark if the registrant is a well-known seasoned issuer, as defined in Rule 405 of the Securities Act. Yes x No ¨
Indicate by check mark if the registrant is not required to file reports pursuant to Section 13 or Section 15(d) of the Act. Yes ¨ No x
Note: Checking the box above will not relieve any registrant required to file reports pursuant to Section 13 or 15(d) of the Exchange Act from their obligations under those Sections.
Indicate by check mark whether the registrant (1) has filed all reports required to be filed by Section 13 or 15(d) of the Securities Exchange Act of 1934 during the preceding 12 months (or for such shorter period that the registrant was required to file such reports), and (2) has been subject to such filing requirements for the past 90 days. Yes x No ¨
Indicate by check mark whether the registrant has submitted electronically every Interactive Data File required to be submitted pursuant to Rule 405 of Regulation S-T (§ 232.405 of this chapter) during the preceding 12 months (or for such shorter period that the registrant was required to submit such files). Yes x No ¨
Indicate by check mark whether the registrant is a large accelerated filer, an accelerated filer, a non-accelerated filer, a smaller reporting company, or an emerging growth company. See the definitions of “large accelerated filer,” “accelerated filer,” “smaller reporting company,” and “emerging growth company” in Rule 12b-2 of the Exchange Act.
| x | Accelerated filer | ¨ | ||||||||||||||||||
| Non-accelerated filer | ¨ | Smaller reporting company | ||||||||||||||||||
| Emerging growth company | ||||||||||||||||||||
If an emerging growth company, indicate by check mark if the registrant has elected not to use the extended transition period for complying with any new or revised financial accounting standards provided pursuant to Section 13(a) of the Exchange Act. ¨
Indicate by check mark whether the registrant has filed a report on and attestation to its management’s assessment of the effectiveness of its internal control over financial reporting under Section 404(b) of the Sarbanes-Oxley Act (15 U.S.C. 7262(b)) by the registered public accounting firm that prepared or issued its audit report. ☒
If securities are registered pursuant to Section 12(b) of the Act, indicate by check mark whether the financial statements of the registrant included in the filing reflect the correction of an error to previously issued financial statements. ☐
Indicate by check mark whether any of those error corrections are restatements that required a recovery analysis of incentive-based compensation received by any of the registrant's executive officers during the relevant recovery period pursuant to §240.10D-1(b) ☐
Indicate by check mark whether the registrant is a shell company (as defined in Rule 12b-2 of the Act). Yes ☐ No x
The aggregate market value of the shares of Class A Common Stock held by non-affiliates of the registrant, computed by reference to the closing price of such stock on June 30, 2024, was $87.4 billion. At January 31, 2025, there were 1,293,525,167 shares of the registrant’s Class A Common Stock outstanding.
Documents Incorporated by Reference
Portions of the registrant’s definitive proxy statement to be filed with the Securities and Exchange Commission in connection with its annual meeting of shareholders expected to be held on May 21, 2025 are incorporated by reference into Part III hereof.
Mondelēz International, Inc.
| Page No. | ||||||||
| Item 1. | ||||||||
| Item 1A. | ||||||||
| Item 1B. | ||||||||
| Item 1C. | ||||||||
| Item 2. | ||||||||
| Item 3. | ||||||||
| Item 4. | ||||||||
Item 5. | ||||||||
| Item 6. | ||||||||
| Item 7. | ||||||||
| Item 7A. | ||||||||
| Item 8. | ||||||||
| Item 9. | ||||||||
| Item 9A. | ||||||||
| Item 9B. | ||||||||
| Item 9C. | ||||||||
| Item 10. | ||||||||
| Item 11. | ||||||||
Item 12. | ||||||||
| Item 13. | ||||||||
| Item 14. | ||||||||
| Item 15. | ||||||||
| Item 16. | ||||||||
In this report, for all periods presented, “we,” “us,” “our,” “the Company” and “Mondelēz International” refer to Mondelēz International, Inc. and subsidiaries. References to “Common Stock” refer to our Class A Common Stock.
 | ||||||||
Forward-Looking Statements
This report contains “forward-looking statements” within the meaning of Section 27A of the Securities Act of 1933, as amended, and Section 21E of the Securities Exchange Act of 1934, as amended. All statements other than statements of historical fact are “forward-looking statements” for purposes of federal and state securities laws, including any projections of earnings, revenue or other financial items; any statements of the plans, strategies and objectives of management, including for future operations, capital expenditures or share repurchases; any statements concerning proposed new products, services, or developments; any statements regarding future economic conditions or performance; any statements of belief or expectation; and any statements of assumptions underlying any of the foregoing or other future events. Forward-looking statements may include, among others, the words, and variations of words, “will,” “may,” “expect,” “would,” “could,” “might,” “intend,” “plan,” “believe,” “likely,” “estimate,” “anticipate,” “objective,” “predict,” “project,” “drive,” “seek,” “aim,” “target,” “potential,” “commitment,” “outlook,” “continue” or any other similar words.
Although we believe that the expectations reflected in any of our forward-looking statements are reasonable, actual results or outcomes could differ materially from those projected or assumed in any of our forward-looking statements. Our future financial condition and results of operations, as well as any forward-looking statements, are subject to change and to inherent risks and uncertainties, many of which are beyond our control and are amplified by current and potential trade and tariff actions affecting the countries where we operate. Important factors that could cause our actual results or performance to differ materially from those contained in or implied by our forward-looking statements include, but are not limited to, the following:
•weakness in macroeconomic conditions in our markets, including as a result of inflation (and related monetary policy actions by governments in response to inflation) and the instability of certain financial institutions;
•risks from operating globally including geopolitical, trade, tariff and regulatory uncertainties affecting developed and emerging markets;
•volatility of cocoa and other commodity input costs, our ability to effectively hedge such costs and the availability of commodities;
•geopolitical uncertainty, including the impact of ongoing or new developments in Ukraine and the Middle East, related current and future sanctions imposed by governments and other authorities and related impacts, including on our business operations, employees, reputation, brands, financial condition and results of operations;
•competition and our response to channel shifts and pricing and other competitive pressures;
•pricing actions and customer and consumer responses to such actions;
•promotion and protection of our reputation and brand image;
•weakness in consumer spending and/or changes in consumer preferences and demand and our ability to predict, identify, interpret and meet these changes;
•the outcome and effects on us of legal and tax proceedings and government investigations;
•use of information technology and third party service providers;
•unanticipated disruptions to our business, such as malware incidents, cyberattacks or other security breaches, and supply, commodity, labor and transportation constraints;
•our ability to identify, complete, manage and realize the full extent of the benefits, cost savings, efficiencies and/or synergies presented by strategic acquisitions and other transactions as well as other strategic initiatives, such as our ERP System Implementation program;
•our investments and our ownership interests in those investments;
•the impact of climate change on our supply chain and operations;
•global or regional health pandemics or epidemics;
•consolidation of retail customers and competition with retailer and other economy brands;
•changes in our relationships with customers, suppliers or distributors;
•management of our workforce and shifts in labor availability or labor costs;
•compliance with legal, regulatory, tax and benefit laws and related changes, claims or actions;
•perceived or actual product quality issues or product recalls;
•failure to maintain effective internal control over financial reporting or disclosure controls and procedures;
•our ability to protect our intellectual property and intangible assets;
•tax matters including changes in tax laws and rates, disagreements with taxing authorities and imposition of new taxes;
•changes in currency exchange rates, controls and restrictions;
1 | | |||||||
•volatility of and access to capital or other markets, interest rates, the effectiveness of our cash management programs and our liquidity;
•pension costs;
•significant changes in valuation factors that may adversely affect our impairment testing of goodwill and intangible assets; and
•the risks and uncertainties, as they may be amended from time to time, set forth in our filings with the U.S. Securities and Exchange Commission, including this Annual Report on Form 10-K and subsequent Quarterly Reports on Form 10-Q.
There may be other factors not presently known to us or which we currently consider to be immaterial that could cause our actual results to differ materially from those projected in any forward-looking statements we make. We disclaim and do not undertake any obligation to update or revise any forward-looking statement in this report except as required by applicable law or regulation. In addition, historical, current and forward-looking sustainability-related statements may be based on standards for measuring progress that are still developing, internal controls and processes that continue to evolve, and assumptions that are subject to change in the future.
2 | | |||||||
PART I
Item 1. Business.
General
Mondelēz International’s purpose is to empower people to snack right. We sell our products in over 150 countries around the world. We are one of the world’s largest snack companies with global net revenues of $36.4 billion and net earnings of $4.6 billion in 2024. Our core business is making and selling chocolate, biscuits and baked snacks. We also have additional businesses in adjacent, locally relevant categories including gum & candy, cheese & grocery and powdered beverages. Our portfolio includes iconic global and local brands such as Oreo, Ritz, LU, Clif Bar and Tate’s Bake Shop biscuits and baked snacks, as well as Cadbury Dairy Milk, Milka and Toblerone chocolate.
We strive to create a positive impact on the world and communities in which we operate while driving business performance. Our goal is to lead the future of snacking around the world by offering the right snack, for the right moment, made the right way. We aim to deliver a broad range of delicious, high-quality snacks that nourish life’s moments, made with sustainable ingredients and packaging.
Strategy
We aim to be the global leader in snacking by focusing on growth, execution, culture and sustainability. We are optimizing our portfolio of leading brands and have refined our strategy to accelerate growth, prioritizing our fast-growing core categories of chocolate, biscuits and baked snacks. Our strategic plan builds on our strong foundations, including leadership in attractive categories, an attractive global footprint, a strong core of iconic global and local brands, marketing, sales, distribution and cost excellence capabilities and top talent with a growth mindset.
Our plan to drive long-term growth includes four strategic priorities:
•Accelerate consumer-centric growth. Our consumers are the reason we want to be the best snacking company in the world, and we put them at the heart of everything we do. With our consumers in mind, we are focused on accelerating and increasing our focus on chocolate, biscuits and baked snacks by investing in both our global and local brands. We are working to deliver multi-category growth in key geographies, expand our presence in high growth channels and increase our presence in under-represented segments and price tiers. As demands on consumers’ time increase and consumer eating habits evolve, we aim to meet consumers' snacking needs. We plan to test, learn and scale new product offerings quickly to meet diverse and evolving local and global snacking demand.
•Drive operational excellence. Our operational excellence and continuous improvement plans include a special focus on the consumer-facing areas of our business and optimizing our sales, marketing and customer service efforts. To drive productivity gains and cost improvements across our business, we also plan to continue leveraging our global shared services platform, driving greater efficiencies in our supply chain informed by a consumer-centric approach and applying strong cost discipline across our operations. We expect the improvements and efficiencies we drive will fuel our growth and continue to expand profit dollars. We are also focused on boosting digital commerce and on our digital transformation program that will help us to meet consumer demand and generate incremental sales opportunities.
•Build a winning growth culture. To support the acceleration of our growth, we are becoming more agile, digital and local-consumer focused. We are committed to investing in a diverse and talented workforce that helps our business move forward with greater speed and agility along with future-forward growth capabilities. We empower our local teams to innovate and deliver consumers’ snacking needs while continuing to leverage our global scale to efficiently support our growth strategy. We have given our local teams more autonomy to drive commercial and innovation plans as they are closer to the needs and desires of consumers. We will continue to leverage the efficiency and scale of our regional operating units while empowering our local and commercial operations to respond faster to changing consumer preferences and capitalize on growth opportunities. We believe our efforts to continue advancing a winning growth culture will help drive profitable top-line growth.
3 | | |||||||
•Scale sustainable snacking. We continue to focus significant efforts to drive progress against our core initiatives for more sustainable and mindful snacking. We have a clear strategic approach to focus on the areas where we believe we can drive the most impact with a sustainable snacking strategy, with environmental, social and governance (“ESG”) goals and initiatives that include significant involvement and oversight by our leadership and Board of Directors. This includes ongoing efforts to sustainably source key ingredients, reduce our end-to-end environmental impact and innovate our processes and packaging to reduce waste and promote recycling. Please see our Sustainability and Mindful Snacking section below.
We run our business with a long-term perspective and we believe the successful delivery of our strategic plan will drive consistent top- and bottom-line growth and enable us to create long-term value for our shareholders.
Global Operations
We sell our products in over 150 countries and have operations in approximately 80 countries, including 147 principal manufacturing and processing facilities across 46 countries. The portion of our net revenues generated outside the United States was 74.0% in 2024, 73.4% in 2023 and 73.6% in 2022. For more information on our U.S. and non-U.S. operations, refer to Note 18, Segment Reporting; on our manufacturing and other facilities, refer to Item 2, Properties; and on risks related to our operations outside the United States, see Item 1A, Risk Factors.
We also monitor our revenue growth across emerging markets and developed markets:
•Our emerging markets include our Latin America region in its entirety; the Asia, Middle East and Africa (“AMEA”) region, excluding Australia, New Zealand and Japan; and the following countries from the Europe region: Russia, Ukraine, Türkiye, Kazakhstan, Georgia, Poland, Czech Republic, Slovak Republic, Hungary, Bulgaria, Romania, the Baltics and the East Adriatic countries.
•Our developed markets include the entire North America region, the Europe region excluding the countries included in the emerging markets definition, and Australia, New Zealand and Japan from the AMEA region.
Reportable Segments
Our operations and management structure are organized into four operating segments:
•Latin America
•AMEA
•Europe
•North America
We manage our operations by region to leverage regional operating scale, manage different and changing business environments more effectively and pursue growth opportunities as they arise across our key markets. Our regional management teams have responsibility for the business, product categories and financial results in the regions.
Please see Note 18, Segment Reporting and Management’s Discussion and Analysis of Financial Condition and Results of Operations for additional information.
Product Categories
Our brands span five product categories:
•Biscuits & Baked Snacks (including cookies, crackers, salted snacks, snack bars and cakes & pastries)
•Chocolate
•Gum & candy
•Beverages
•Cheese & grocery
Seasonality
Demand for our products is generally balanced throughout the year, with increases in the fourth quarter primarily because of holidays and other seasonal events. Depending on the timing of Easter, the holiday sales may shift between and affect net revenue in the first and second quarter.
4 | | |||||||
Customers
We generally sell our products to supermarket chains, wholesalers, supercenters, club stores, mass merchandisers, distributors, convenience stores, gasoline stations, drug stores, value stores and other retail food outlets. We also sell products directly to businesses and consumers through various pure play e-retail platforms, retailer digital platforms, our direct-to-consumer websites and social media platforms. No single customer accounted for 10% or more of our net revenues from continuing operations in 2024. For a discussion of long-term demographics, consumer trends and demand, refer to our Financial Outlook within Management’s Discussion and Analysis of Financial Condition and Results of Operations.
Distribution and Marketing
Our product distribution network encompasses direct store delivery, company-owned and satellite warehouses, distribution centers, third party distributors and other facilities. Additionally, we leverage the services of independent sales offices and agents in various international locations. Through our global digital commerce organization and capabilities, we pursue online growth with partners in key markets around the world, including both pure e-tailers and omni-channel retailers. We continue to invest in advertising and consumer promotions, talent and digital capabilities. Our digital commerce channel strategies play a critical role in our ambition to be the global leader in snacking.
Our marketing initiatives are categorized in three principal sets of activities: (i) consumer marketing and advertising including digital and social media, on-air, print, outdoor and other product promotions; (ii) consumer sales incentives such as coupons and rebates; and (iii) trade promotions to support price features, displays and other merchandising of our products by our customers.
Research, Development and Innovation
Our innovation and new product development objectives include continuous improvement in food safety and quality, growth through new products, superior consumer satisfaction and reduced production costs. We have established a robust framework for innovation to drive a technology pipeline supporting the creation of new product bundles across short-, medium- and long-term horizons. These bundles enhance our portfolio to address evolving consumer preferences and market trends, nutritional needs as well as reduce our environmental impact. We work to test and learn new ideas and implement successful ones into other areas of our business. To drive growth, creativity, greater effectiveness, improved efficiency and accelerated project delivery, we are focusing our technical research and development resources at technical centers around the globe.
Mindful snacking and sustainability are a significant focus of our current research and development initiatives. We work to introduce new varieties of our core products, including new taste or nutrition profiles that cater to evolving consumer preferences, such as the launch in the UK of Cadbury Dairy Milk & MORE, a multi-dimensional tablet designed to deliver a richer, more indulgent eating experience, zero-sugar Oreo’s in China and reduced sugar candies under The Natural Confectionary Company brand in Australia. We continue to expand our portfolio of cakes and pastries in new markets and with updated formats including Milka brownies and Oreo cakes.
We also have a dedicated innovation and venture hub, SnackFutures, specifically tailored to leverage emerging consumer trends and growth opportunities in mindful snacking. The core objectives of this group are aligned with three key strategic areas: invent new brands and businesses, invest in early-stage entrepreneurs and amplify SnackFutures’ influence through the CoLab start-up engagement and mentoring programs built to equip start-ups with essential tools, technologies and expertise that can help them learn, grow and succeed.
Competition
We operate in highly competitive markets that are comprised of global, regional and local competitors, including new start-up brands and businesses. Some competitors have different profit objectives and investment time horizons than we do and therefore may approach pricing and promotional decisions differently. We compete based on product quality, brand recognition and loyalty, service, product innovation, taste, convenience, nutritional value, the ability to identify and satisfy consumer preferences, effectiveness of our digital and other sales and marketing strategies, routes to market and distribution networks, promotional activities and price. Our advantaged global footprint, operating scale and portfolio of brands have all significantly contributed to building our market-leading positions across most of the product categories in which we sell. To grow and maintain our market positions, we
5 | | |||||||
focus on meeting consumer needs and preferences through a local-first commercial focus with a broad array of product formats, pack sizes and price points, new digital and other sales and marketing initiatives, product innovation and high standards of product quality. We also continue to optimize our manufacturing and supply chain networks and invest in our brands through ongoing research and development, advertising, marketing and consumer promotions.
Raw Materials and Packaging
We purchase and use large quantities of commodities, including cocoa, dairy, wheat, edible oils, sugar and other sweeteners, flavoring agents and nuts. In addition, we purchase and use significant quantities of packaging materials to package our products and natural gas, fuels and electricity for our factories and warehouses. We monitor worldwide supply, commodity cost and currency trends so we can sustainably and cost-effectively secure ingredients, packaging and fuel required for production.
A number of external factors such as the current macroeconomic environment, including global inflation and the effects of geopolitical uncertainty, climate and weather conditions, trade and regulatory uncertainty, commodity, transportation and labor market conditions, supply chain disruptions, currency fluctuations and the effects of governmental agricultural or other programs affect the cost and availability of raw materials and agricultural materials used in our products. We address higher commodity costs and currency impacts primarily through hedging, higher pricing and manufacturing and overhead cost control. We use hedging techniques to limit the impact of fluctuations in the cost of our principal raw materials; however, we may not be able to fully hedge against commodity cost changes, and our hedging strategies may not protect us from increases in specific raw material costs.
For additional information, refer to Management’s Discussion and Analysis of Financial Condition and Results of Operations and Commodity Trends.
Human Capital
We believe the strength of our workforce is one of the significant contributors to our success as a purpose-led, global company. All our employees contribute to our success and help us drive strong financial performance. Attracting, developing and retaining global talent with the right skills to drive our business is central to our purpose, mission and long-term growth strategy.
Workforce Profile: At December 31, 2024, we had approximately 90,000 employees. At December 31, 2024, we had approximately 12,000 U.S. employees and approximately 78,000 employees outside the United States, with employees represented by labor unions or workers’ councils representing approximately 20% of our U.S. employees and approximately 60% of our employees outside the United States.
Workplace Safety and Wellness: We promote a strong culture of safety and prioritize keeping all our employees, contractors and visitors safe. To accomplish this, we employ comprehensive health, safety and environment management policies and standards throughout the organization. In addition, we strive to continuously improve our work processes, tools and metrics to mitigate and prevent workplace injuries and enhance safety.
We remain committed to providing a modern and flexible approach to how and where we work. Our hybrid work model allows our office-based employees to engage with colleagues, customers and suppliers in-person on a regular basis while also leveraging innovative technology to optimize collaboration across geographically dispersed teams.
Talent Management and Development: Maintaining a robust pipeline of talent is crucial to our ongoing success and to our succession planning efforts across the organization. Our leadership and people teams are responsible for attracting and retaining top talent by facilitating an environment where employees feel supported and encouraged in their professional and personal development.
Specifically, we review strategic positions regularly and identify potential internal candidates to fill those roles, evaluating job skill sets to identify competency gaps and creating developmental plans to facilitate employee professional growth. We believe in supporting a healthy balance between development and advancement of internal talent and infusion of new talent and capabilities to enhance our teams.
6 | | |||||||
We invest in our employees through training and development programs, on the job experiences, coaching, as well as tuition reimbursement, for a majority of our employees in the United States to promote continued professional growth. We provide access to technical and leadership development programs to enable colleagues to grow skills and capabilities to become more successful. We also have dedicated talent programs that support and accelerate leadership development and strengthen our succession plans. We have expanded and increased global participation in our Talent Marketplace, a development solution that helps connect employees to short-term ‘gig’ opportunities. Additionally, coaching, mentoring and team-based development solutions are provided to colleagues across all levels to support leadership, team effectiveness and performance.
Culture and Employee Engagement: We believe that a diverse workforce with a range of experiences and perspectives is a significant driver of sustainable innovation and growth. We continue to focus on creating an inclusive culture for employees, providing all employees with opportunities through our development programs and policies. We believe a culture where employees feel heard and managers take action is key to building a highly-engaged workforce that can deliver sustainable business growth. We conduct confidential engagement surveys of our global workforce annually that are administered and analyzed by an independent third party. Aggregate survey results include external benchmark comparisons and are reviewed by executive officers and the Board of Directors. Based on the results, we create action plans at global, regional, functional and managerial levels. By acting on results both at an aggregate enterprise level and a department/business/work group level, we have been able to enhance our culture and improve our overall engagement.
Total Rewards: As part of our total rewards philosophy, we offer competitive compensation and benefits to attract and retain top talent. Our compensation programs are designed to reinforce our growth agenda and talent strategy as well as drive a strong connection between the contributions of our employees and their pay. We believe the structure of our compensation packages provides the appropriate incentives to attract, retain and motivate our employees. Further, to foster a strong sense of ownership and align the interests of employees with shareholders, we grant stock-based incentives to most senior-level employees.
We also continue to evolve our programs to meet our employees’ health and wellness needs. We provide access to medical and welfare benefits and offer programs to all employees that support work-life balance, including paid parental leave, as well as financial, physical and mental health resources, including employee assistance programs that reach all global colleagues.
We are committed to equal pay for equal work, regardless of gender, race, ethnicity or other personal characteristics. To deliver on that commitment, we benchmark and set pay ranges based on market data and consider various factors such as an employee’s role and experience, job location and performance. We also regularly review our compensation practices to promote fair and equitable pay.
With the support of an independent third-party expert in this field, we conduct global pay equity reviews for salaried employees based on gender and, in the United States, race (as permitted by local country law). Our last global analysis in 2024 encompassed 82 countries and over 36,000 employees. From this analysis, our pay gap between male and female employees was less than 1% when performing substantially similar work at Mondelēz. In the United States, we also review pay for salaried employees in the same pay grade by race/ethnicity (Asian, Black and Hispanic). The 2024 independent analysis found no systemic issues and no negative pay gap between non-white and white employees when performing substantially similar work at Mondelēz.
Sustainability and Mindful Snacking
Snacking Made Right is the lens through which we determine our ESG priorities to deliver on our mission of leading the future of snacking by offering the right snack, for the right moment, made the right way. We have a clear strategic approach to making snacking right, so we can drive innovative, more sustainable business growth.
We focus in key areas where we believe we can deliver greater long-term positive impact. Our strategy and goals in these key focus areas are central to supporting our growth around the world and underpinned by our focus on promoting a culture of safety, quality and inclusivity. Our goals include more sustainable sourcing of key ingredients, reducing our environmental footprint, promoting the rights of people across our value chain, and evolving our portfolio to offer a broader range of high-quality snacks addressing consumer needs while encouraging consumers to snack mindfully. In 2024, we made progress against these goals, such as receiving validation for our 2030 near-
7 | | |||||||
term and 2050 long-term Net Zero goal from the Science Based Targets Initiative and continuing to increase the ratio of renewable energy used within several of our owned manufacturing facilities across the world.
The Governance, Membership and Sustainability Committee of our Board of Directors oversees our ESG policies and programs related to corporate citizenship, social responsibility, and public policy issues significant to us such as sustainability and environmental responsibility; food labeling, marketing and packaging; philanthropic and political activities and contributions; and Board of Directors’ ESG education and capabilities. The People and Compensation Committee of our Board of Directors oversees our human capital priorities, as well as workplace safety and employee wellness, pay equity, talent sourcing strategies, talent management and development programs and KPIs for incentive plans. The Audit Committee of our Board of Directors oversees our safety priorities, goals and performance, as well as our ESG-related disclosure in SEC filings, including controls and assurance. Our ESG goals are part of our risk and strategic planning processes and are also embedded across our organization and within our annual incentive compensation program for our leadership. Business leadership teams and our Board of Directors regularly review progress toward these programs and priorities.
We discuss our ESG goals and programs in detail in our annual Snacking Made Right report available on our website. We also publish an ESG disclosure data sheet and are aligned with the Sustainability Accounting Standards Board and Task Force on Climate-related Financial Disclosures reporting frameworks. We also provide our annual CDP Climate Change, Water Security and Forests disclosure.
Intellectual Property
Our intellectual property rights (including trademarks, patents, copyrights, registered designs, proprietary trade secrets, recipes, technology and know-how) are material to our business.
We own numerous trademarks and patents in many countries around the world. Depending on the country, trademarks remain valid for as long as they are in use or their registration status is maintained. Trademark registrations generally are renewable for fixed terms. We also have patents for a number of current and potential products. Our patents cover inventions ranging from packaging techniques to processes relating to specific products and to the products themselves. Our issued patents extend for varying periods according to the date of patent application filing or grant and the legal term of patents in the various countries where patent protection is obtained. The actual protection afforded by a patent, which can vary from country to country, depends upon the type of patent, the scope of its coverage as determined by the patent office or courts in the country, and the availability of legal remedies in the country. While our patent portfolio is material to our business, the loss of one patent or a group of related patents would not have a material adverse effect on our business.
From time to time, we grant third parties licenses to use one or more of our trademarks, patents and/or proprietary trade secrets in connection with the manufacture, sale or distribution of third-party products. Similarly, we sell some products under brands, patents and/or proprietary trade secrets we license from third parties. In our agreement with Kraft Foods Group, Inc. (which is now part of The Kraft Heinz Company), we each granted the other party various licenses to use certain of our and their respective intellectual property rights in named jurisdictions following the spin-off of our North American grocery business in 2012.
Regulation
Our food products and ingredients are subject to local, national and multinational laws and regulations related to labeling, health and nutrition claims, packaging, pricing, marketing and advertising, and related areas. In addition, various jurisdictions regulate our operations by licensing and inspecting our manufacturing plants and facilities, enforcing standards for select food products, grading food products, and regulating trade practices related to the sale and pricing of our food products. Many of the food commodities we use in our operations are subject to government agricultural policy and intervention. These policies have substantial effects on prices and supplies and are subject to periodic governmental and administrative review. In addition, increased attention to environmental and social issues in industry supply chains has led to the development of differences in government rules across jurisdictions. The lack of a harmonized approach can lead to uneven scrutiny or enforcement, which can impact our operations.
Examples of laws and regulations that affect our business include, without limitation, workplace safety regulations; selective food taxes; data privacy and cybersecurity; ingredients, products, processing or other food-related
8 | | |||||||
restrictions, labeling requirements such as front-of-pack labeling based on nutrient profiles or environmental claims; sales or media and marketing restrictions such as those on promotions or advertising products with specified nutrient profiles on certain channels or platforms or during certain hours of the day; sanctions; export controls on sales or sourcing of raw materials; cross-border trade concessions or border barriers; corporate tax policies of the United States and other countries; and packaging taxes. In addition, many Member States in the European Union have implemented extended producer responsibility (“EPR”) policies as part of national packaging waste policies that make manufacturers responsible for the cost of recycling food and beverage packaging after consumers use it. These range from mandatory regulations to voluntary agreements between government and industry to voluntary industry initiatives. In addition, the European Union has adopted its Packaging and Packaging Waste Directive. EPR policies are being implemented or contemplated in other jurisdictions around the world, including India, Vietnam and certain states in the United States. Single-use plastic bans or plastic taxes are being implemented or considered in Europe as well as countries in Southeast Asia.
Throughout the countries in which we do business, we are subject to local, national and multinational environmental laws and regulations relating to the protection of the environment. We have programs across our business units designed to meet applicable environmental compliance requirements. In the United States, the laws and regulations include the Clean Air Act, the Clean Water Act, the Resource Conservation and Recovery Act and the Comprehensive Environmental Response, Compensation, and Liability Act. We are also subject to legislation designed to reduce emissions from greenhouse gases, and many countries are considering introducing carbon taxes that could increase our production costs or those of our suppliers.
We continue to monitor developments in laws and regulations. Also refer to Item 1A, Risk Factors for additional information.
9 | | |||||||
Information about our Executive Officers
The following are our executive officers as of February 5, 2025:
| Name | Age | Title | ||||||||||||
| Dirk Van de Put | 64 | Chief Executive Officer | ||||||||||||
| Luca Zaramella | 55 | Executive Vice President and Chief Financial Officer | ||||||||||||
| Vinzenz P. Gruber | 59 | Executive Vice President and President, Europe | ||||||||||||
Deepak D. Iyer | 57 | Executive Vice President and President, Asia Pacific, Middle East and Africa | ||||||||||||
Stephanie Lilak | 58 | Executive Vice President and Chief People Officer | ||||||||||||
| Mariano C. Lozano | 58 | Executive Vice President and President, Latin America | ||||||||||||
Martin Renaud | 57 | Executive Vice President , Chief Marketing and Sales Officer | ||||||||||||
| Laura Stein | 63 | Executive Vice President, Corporate & Legal Affairs, General Counsel and Corporate Secretary | ||||||||||||
| Gustavo C. Valle | 60 | Executive Vice President and President, North America | ||||||||||||
Mr. Van de Put became Chief Executive Officer and a director in November 2017 and became Chairman of the Board of Directors in April 2018. He formerly served as President and Chief Executive Officer of McCain Foods Limited, a multinational frozen food provider, from July 2011 to November 2017 and as its Chief Operating Officer from May 2010 to July 2011. Mr. Van de Put served as President and Chief Executive Officer, Global Over-the-Counter, Consumer Health Division of Novartis AG, a global healthcare company, from 2009 to 2010. Prior to that, he worked for 24 years in a variety of leadership positions for several global food and beverage providers, including Danone SA, The Coca-Cola Company and Mars, Incorporated.
Mr. Zaramella became Executive Vice President and Chief Financial Officer in August 2018. He previously served as Senior Vice President Corporate Finance, CFO Commercial and Treasurer from June 2016 to July 2018. He also served as Interim Lead Finance North America from April to November 2017. Prior to that, he served as Senior Vice President and Corporate Controller from December 2014 to August 2016 and Senior Vice President, Finance of Mondelēz Europe from October 2011 to November 2014. Mr. Zaramella joined Mondelēz International in 1996.
Mr. Gruber became Executive Vice President and President, Europe in January 2019. He previously served as President, Western Europe from October 2016 to December 2018 and President, Chocolate, Europe from August 2011 to September 2016. Mr. Gruber was formerly employed by Mondelēz International, in various capacities, from 1989 until 2000 and resumed his employment in September 2007.
Mr. Iyer became Executive Vice President and President, Asia Pacific, Middle East and Africa in June 2023. He previously served as President India from August 2016 to June 2023. Prior to that, Mr. Iyer held various leadership positions of increasing responsibility at PepsiCo, Wrigley India Pvt Ltd and Bharti AXA General Insurance Company, India. Mr. Iyer joined Mondelēz International in 2016.
Ms. Lilak became Executive Vice President and Chief People Officer in January 2024. She formerly served as the Chief People Officer of Bumble Inc., a social networking company, from November 2021 to January 2023. Previously, Ms. Lilak was Senior Vice President, Chief Human Resources Officer at Dunkin’ Brands Group Inc., a multinational coffee and doughnut company, from July 2019 to November 2021. Prior to Dunkin’ Brands, Ms. Lilak spent 23 years with General Mills Inc., a global consumer foods manufacturer and marketer, in roles of increasing responsibility. She served as Vice President, Human Resources for the North America Retail Segment from January 2016 to July 2019.
Mr. Lozano became Executive Vice President and President, Latin America in May 2022. He previously served as CEO of Danone North America, a business unit of Danone SA, a global food and beverage company, from January 2014 until April 2017 and CEO Danone North America from September 2017 until December 2022. Mr. Lozano spent more than 24 years at Danone in various leadership roles across Latin America including President, Danone Brazil.
Mr. Renaud became Executive Vice President and Chief Marketing & Sales Officer in February 2022 and served as Executive Vice President and Chief Marketing Officer from January 2018 until February 2022. Prior to joining
10 | | |||||||
Mondelēz International, Mr. Renaud spend more than 28 years at Danone SA, a global food and beverage company, in a variety of roles with increasing responsibility. Most recently, he served as President, Fresh Dairy Europe, from January 2015 to July 2017 after working as Vice President Danone Waters Asia Pacific, from October 2014 to December 2014.
Ms. Stein became Executive Vice President, Corporate & Legal Affairs, General Counsel and Corporate Secretary in September 2023 and was Executive Vice President, Corporate & Legal Affairs and General Counsel from January 2021 until September 2023. Before joining Mondelēz International, Ms. Stein spent 16 years at The Clorox Company, a multinational manufacturer and marketer of consumer and professional products, most recently as Executive Vice President – General Counsel and Corporate Affairs from February 2016 to December 2020. She also served as Executive Vice President – General Counsel from February 2015 to February 2016 and as Senior Vice President – General Counsel from January 2005 to February 2015.
Mr. Valle became Executive Vice President and President, North America in March 2022 and was Executive Vice President and President, Latin America from February 2020 to February 2022. Before joining Mondelēz International, Mr. Valle served as Chief Executive Officer of Axia Plus, LLC, a management consulting firm, from February 2018 to January 2020. Prior to that he spent more than 20 years at Danone SA, a global food and beverage company, in a variety of leadership positions, most recently as Executive Vice President, Dairy Division Worldwide, from January 2015 to January 2018, and Vice President Dairy Division Europe, from January 2014 until December 2014.
Ethics and Governance
We have adopted the Mondelēz International Code of Conduct, which qualifies as a code of ethics under Item 406 of Regulation S-K. The code applies to all of our employees, including our principal executive officer, principal financial officer, principal accounting officer or controller, and persons performing similar functions. Our code of ethics is available free of charge on our web site at www.mondelezinternational.com/Investors/Corporate-Governance and will be provided free of charge to any shareholder submitting a written request to: Corporate Secretary, Mondelēz International, Inc., 905 West Fulton Market, Suite 200, Chicago, IL 60607. We will disclose any waiver we grant to an executive officer or director under our code of ethics, or certain amendments to the code of ethics, on our web site at www.mondelezinternational.com/Investors/Corporate-Governance.
In addition, we have adopted Corporate Governance Guidelines, charters for each of the Board’s four standing committees and the Code of Business Conduct and Ethics for Non-Employee Directors. All of these materials are available on our web site at www.mondelezinternational.com/Investors/Corporate-Governance and will be provided free of charge to any shareholder requesting a copy by writing to: Corporate Secretary, Mondelēz International, Inc., 905 West Fulton Market, Suite 200, Chicago, IL 60607.
Available Information
Our Internet address is www.mondelezinternational.com. Our Annual Reports on Form 10-K, Quarterly Reports on Form 10-Q, Current Reports on Form 8-K and amendments to those reports filed or furnished pursuant to Section 13(a) or 15(d) of the Securities Exchange Act of 1934, as amended (the “Exchange Act”), are available free of charge as soon as possible after we electronically file them with, or furnish them to, the U.S. Securities and Exchange Commission (the “SEC”). You can access our filings with the SEC by visiting www.sec.gov or our website: ir.mondelezinternational.com/sec-filings. The information on our web site is not, and shall not be deemed to be, a part of this Annual Report on Form 10-K or incorporated into any other filings we make with the SEC.
11 | | |||||||
Item 1A. Risk Factors.
You should carefully read the following discussion of significant factors, events and uncertainties when evaluating our business and the forward-looking information contained in this Annual Report on Form 10-K. The events and consequences discussed in these risk factors could materially and adversely affect our business, operating results, liquidity and financial condition. While we believe we have identified and discussed below the key risk factors affecting our business, these risk factors do not identify all the risks we face, and there may be additional risks and uncertainties that we do not presently know or that we do not currently believe to be significant that may have a material adverse effect on our business, performance or financial condition in the future. In addition to the effects of current and potential trade and tariff policies and resulting global impacts on our business and operations discussed in Item 7 of this Form 10-K and in the risk factors below, additional or unforeseen effects from these policies may give rise to or amplify many of these risks discussed below.
Strategic and Operational Risks
Commodity and other input prices are volatile and may increase or decrease significantly or availability of commodities may become constrained.
We purchase and use large quantities of commodities, including cocoa, dairy, wheat, edible oils, sugar and other sweeteners, flavoring agents and nuts. In addition, we purchase and use significant quantities of product packaging materials, natural gas, fuel and electricity for our factories and warehouses, and we also incur expenses in connection with labor and the transportation and delivery of our products. Costs of raw materials, energy and other supplies and services are volatile and fluctuate due to conditions that are difficult to predict. These conditions include global competition for resources; tariffs or other trade barriers; currency fluctuations; geopolitical conditions or conflicts (including the ongoing war in Ukraine and international sanctions imposed on Russia for its invasion of Ukraine, conflicts in the Middle East and rising tensions between China and Taiwan); inflationary pressures related to domestic and global economic conditions or supply chain issues; transportation and labor disruptions; government intervention to introduce living income premiums or similar requirements; changes in environmental or trade policy and regulations, alternative energy and agricultural programs; severe weather; agricultural productivity; crop disease or pests; water risk; health pandemics; forest fires and other natural disasters; acts of terrorism; geopolitical regional conflicts; cybersecurity incidents; supplier capacity; and consumer or industrial demand. During 2024, price volatility and higher aggregate costs were driven by a confluence of factors: disrupted international supply chains, labor market challenges, soaring commodity prices (especially for cocoa beans) and increased transportation and labor costs. For additional information, see Item 7, Commodity Trends.
Many of these conditions are or could be exacerbated or worsened by climate change. Increased government intervention and consumer or activist responses caused by increased focus on climate change, deforestation, water, plastic waste, animal welfare and human rights concerns and other risks associated with the global food system could adversely affect our or our suppliers’ reputation and business and our ability to procure the materials we need to operate our business. Some commodities are grown by smallholder farmers who might not be able to invest to increase productivity or adapt to changing conditions.
Our efforts to monitor our exposure to commodity prices and hedge against price increases cannot fully protect us from changes in input costs, including due to factors like changing import duties and tariffs, market illiquidity, specific local regulations and downstream costs. Thus, our hedging strategies have not always protected and will not in the future always protect us from increases in specific raw material costs. Continued volatility in the prices of commodities and other supplies we purchase or changes in the types of commodities we purchase as we continue to evolve our product and packaging portfolio could increase or decrease the costs of our products, and our profitability could suffer as a result. Moreover, increases in the price of our products, including increases to cover inflation and higher input, packaging and transportation costs, may result in lower sales volumes or customer delistings, while decreases in input costs could require us to lower our prices and thereby affect our revenues, profits or margins. Likewise, constraints in the supply or availability of key commodities and necessary services like transportation may limit our ability to grow our net revenues and earnings. If our mitigation activities are not effective, if we are unable to price to cover increased costs (including if we are delayed in our ability to raise prices or unable to raise the prices of our products enough to keep up with the rate of inflation), if we must reduce our prices, if increased prices affect demand for our products (including if consumers forego purchasing certain of our products or switch to “private label” or lower-priced product offerings), or if we are limited by supply or distribution constraints, our financial condition, results of operations, cash flows and stock price can be materially adversely affected.
12 | | |||||||
We are subject to risks from operating globally, including potential cost impacts of any tariffs that may be enacted by governments as well as other trade and regulatory uncertainty.
We are a global company and generated 74.0% of our 2024 net revenues, 73.4% of our 2023 net revenues and 73.6% of our 2022 net revenues outside the United States. We market our products in over 150 countries and have operations in approximately 80 countries. Therefore, we are subject to risks inherent in global operations. Those risks include:
•the imposition of increased or new tariffs, sanctions, export controls, quotas, trade barriers, price floors or similar restrictions on our sales or key commodities like cocoa, potential changes in U.S. trade programs and trade relations with other countries, or regulations, taxes or policies that affect our operations, sales or profitability. Also see “We are subject to risks from changes to the trade policies and tariff and import/export regulations by the U.S. and/or other foreign governments”;
•changing macroeconomic conditions in our markets, including as a result of inflation (and related monetary policy actions by governments in response to inflation), volatile commodity prices, the ongoing longer-term impact of changes in international trade policies (including Brexit) and increases in the cost of raw and packaging materials, labor, energy and transportation;
•compliance with U.S. laws affecting operations outside of the United States, including anti-bribery laws such as the Foreign Corrupt Practices Act (“FCPA”);
•compliance with antitrust and competition laws, trade laws, data privacy laws, anti-bribery laws, human rights laws, new regulations intended to address increasing global concerns around forced labor, and a variety of other local, national and multinational regulations and laws in multiple regimes;
•currency devaluations or fluctuations in currency values, including in developed and emerging markets. This includes events like applying highly inflationary accounting as we did for our Argentinean subsidiaries beginning in the third quarter of 2018, Türkiye beginning in the second quarter of 2022 and both Egypt and Nigeria beginning in the fourth quarter of 2024;
•changes in capital controls, including currency exchange controls, government currency policies or other limits on our ability to import raw materials or finished products into various countries or repatriate cash from outside the United States;
•increased sovereign risk, such as defaults by or deterioration in the economies and credit ratings of governments, particularly in emerging markets;
•changes or inconsistencies in local regulations and laws, the uncertainty of enforcement of remedies in non-U.S. jurisdictions, and foreign ownership restrictions and the potential for nationalization or expropriation of property or other resources;
•varying abilities to enforce intellectual property and contractual rights;
•discriminatory or conflicting fiscal policies;
•greater risk of uncollectible accounts and longer collection cycles; and
•design, implementation and use of effective control environment processes across our diverse operations and employee base.
In addition, increased political and economic changes or volatility, geopolitical regional conflicts, terrorist activity, political unrest, civil strife, acts of war, government shutdowns, product boycotts, travel or immigration restrictions, tariffs and other trade restrictions, public health risks or pandemics, energy policy or restrictions, public corruption, expropriation and other economic or political uncertainties, including inaccuracies in our assumptions about these factors, could interrupt and negatively affect our business operations or customer demand. For example, the ongoing conflicts in the Middle East could impact demand for our products or result in increased supply chain costs or other cost impacts. High unemployment or the slowdown in economic growth in some markets could constrain consumer spending. Declining consumer purchasing power could result in loss of market share and adversely impact our profitability. The nature and degree of the various risks we face can also differ significantly among our regions and businesses.
All of these factors could result in increased costs or decreased revenues and could materially and adversely affect our product sales, financial condition, results of operations, cash flows, stock price, and our relationships with customers, suppliers and employees in the short- or long-term.
We are subject to risks from changes to the trade policies and tariff and import/export regulations by the U.S. and/or other foreign governments.
Changes in the import and export policies, including trade restrictions, new or increased tariffs or quotas, embargoes, sanctions and countersanctions, safeguards or customs restrictions by the U.S. and/or other foreign
13 | | |||||||
governments, could require us to change the way we conduct business and adversely affect our financial condition, results of operations, reputation and our relationships with customers, suppliers and employees in the short- or long-term. Likewise, changes in laws and policies governing foreign trade, manufacturing, development and investment in the territories or countries where we currently sell our products or conduct our business could adversely affect our business.
As an example, on February 1, 2025, the U.S. government announced a 25% tariff on product imports from certain countries, including Mexico and Canada, and 10% tariffs on product imports from certain countries, including China. These actions are expected to result in retaliatory measures on U.S. goods. If maintained, the newly announced tariffs and the potential escalation of trade disputes could pose a significant risk to our business and would affect our revenue and cost of goods sold. The extent and duration of the tariffs and the resulting impact on general economic conditions and on our business are uncertain and depend on various factors, such as negotiations between the U.S. and affected countries, the responses of other countries or regions, exemptions or exclusions that may be granted, availability and cost of alternative sources of supply, and demand for our products in affected markets. Further, actions we take to adapt to new tariffs or trade restrictions may cause us to modify our operations or forgo business opportunities. For additional information, see Financial Outlook – Trade and Regulatory Uncertainty under Management's Discussion and Analysis of Financial Condition and Results of Operations.
The war in Ukraine has impacted and could continue to impact our business operations, financial performance and results of operations.
The war in Ukraine has impacted and could continue to impact our business operations, financial performance and results of operations (as discussed below in Recent Developments and Significant Items Affecting Comparability – War in Ukraine under Management’s Discussion and Analysis of Financial Condition and Results of Operations). The scope and duration of the war in Ukraine is uncertain and rapidly changing, and we are unable to predict the full extent to which the war in Ukraine will impact our business operations, financial performance, results of operations and stock price in the future. We have discontinued new capital investments and suspended our advertising spending in Russia. As the business and geopolitical environment continues to change, our operations and activity in Russia, which accounted for 2.9% of 2024 consolidated net revenues, or Ukraine, which accounted for 0.4% of 2024 consolidated net revenues, may decline or be further scaled back. International sanctions, export controls and other measures, including restrictions on the transfer of funds to and from Russia, that have been imposed on Russian entities make it more difficult to operate in Russia, and failure to comply with applicable sanctions and measures could subject us to regulatory penalties and reputational risk. The war could also result in the temporary or permanent loss of assets due to expropriation or further curtailment of our ability to conduct business operations in Russia, and our Russian assets may become partially or fully impaired or our operations may be deconsolidated in future periods, or our business operations terminated, based on actions taken by Russia, other parties or us. In addition, our operations may be subject to increased disruptions to our information systems, including through network failures, malicious or disruptive software or cyberattacks by hackers, criminal groups or nation-state organizations. There is a possibility of loss of life and physical damage and destruction of property. We may not be able to operate in certain areas due to damage and safety concerns. We might also face questions or negative scrutiny from stakeholders about our operations in Russia despite our role as a food company and our public statements about Ukraine and Russia.
The war in Ukraine has continued to result in worldwide geopolitical and macroeconomic uncertainty. The war continues to disrupt commodity markets, including for wheat, energy and energy-related commodities, and continues to contribute to supply chain disruption and inflation. Other ongoing consequences of the war have included increased volatility of input prices, including for packaging materials, energy, commodities, other raw materials, labor and transportation; adverse changes in international trade policies and relations; increased exposure to foreign currency fluctuations, including volatility of the Russian ruble; constraints, volatility or disruptions in the credit and capital markets; increased costs to ensure compliance with global and local laws and regulations; difficulty protecting and enforcing our intellectual property rights; and heightened risk to employee safety including health and safety risks related to securing and maintaining facilities. We expect continued volatility with respect to commodity and other input prices, and our hedging activities might not sufficiently offset this volatility.
These and other impacts of the war in Ukraine could have the effect of heightening many of the other risks described in the risk factors presented in this filing, including those relating to our reputation, brands, product sales, sanctions, trade relations in countries in which we operate, input price inflation and volatility, results of operations and financial condition. We might not be able to predict or respond to all impacts on a timely basis to prevent near-
14 | | |||||||
or long-term adverse impacts to our results. The ultimate impact of these disruptions also depends on events beyond our knowledge or control, including the scope and duration of the war and actions taken by parties other than us to respond to them. Any of these disruptions could have a negative impact on our business operations, financial performance, results of operations and stock price, and this impact could be material. Additionally, the war in Ukraine, or related developments in Russia, Europe or elsewhere, may also materially adversely affect our operating results and financial position in a manner that is not currently known to us or that we do not currently consider to be a significant risk.
We operate in a highly competitive industry where we face risks related to the execution of our strategy as well as our ability or willingness to respond, timely or otherwise, to channel shifts, pricing and other competitive pressures.
The food and snacking industry is highly competitive. Our principal competitors are food, snack and beverage companies that operate globally, regionally and locally, and, in many markets, include retailers with their own branded and private label products. Failure to effectively respond to actions, innovations or other challenges from our competitors could adversely affect our business.
Competitor and customer pressures require that we timely and effectively respond to changes in relevant markets, including changes to distribution channels and technological developments. These pressures could affect our prices, including our ability to price in response to commodity and other cost increases. Our ability to succeed depends on our ability to adapt to changing market conditions, which includes identifying and responding to new or developing trends, technological advancements (including advancements such as artificial intelligence, machine learning and augmented reality) which are increasingly important for understanding evolving consumer preferences. Our ability to adjust distribution methods and pricing, including adapting to fluctuating inflation, new or increased tariffs and/or trade barriers, economic conditions and recessions, as well as implementing effective trade incentives is also critical to advancing our priorities. Failure in these areas could negatively impact availability of or demand for our products, our operating results, achievement of our strategic and financial goals and our ability to capitalize on new revenue or value-producing opportunities.
The rapid growth of some channels, such as discounters and digital commerce, may impact our current operations or strategies more quickly than we planned for, create consumer price deflation, alter the buying behavior of consumers or disrupt our retail customer relationships. We may need to increase or reallocate spending on existing and new distribution channels and technologies, marketing, advertising and new product innovation to maintain or increase revenues, market share and brand significance. These expenditures may not be successful, including those related to our digital commerce and other technology-focused efforts, and might not result in trade and consumer acceptance of our efforts, which could materially and adversely affect our product sales, financial condition, results of operations and cash flows. We will be disadvantaged if we are not able to effectively leverage developing online channels such as direct-to-consumer and electronic business-to-business commerce. New distribution channels, as well as growing opportunities to utilize external manufacturers, lower the barriers to entry and allow smaller competitors to gain market share more effectively. Additionally, if we adjust pricing but cannot maintain or increase sales volumes, or our labor or other costs increase but we cannot increase prices to offset those changes, our financial condition and results of operations will suffer.
Further, our ability to compete may be limited by an inability to secure new retailers or maintain or add shelf and/or retail space for our products. There can be no assurance that retailers will provide sufficient, or any, shelf space, nor that online retailers will provide online access to, or adequate product visibility on, their platform. Unattractive placement or pricing may put our products at a disadvantage compared to those of our competitors. Even if we obtain shelf space or preferable shelf placement, our new and existing products may fail to achieve the sales or pricing expectations set by our retailers, potentially causing these retailers to remove our products from their shelves.
During 2024, we continued to operate under our strategy to drive long-term growth by focusing on four strategic priorities: accelerating consumer-centric growth, driving operational excellence, creating a winning growth culture and scaling sustainable snacking. If our strategy is not effective, we fail to achieve our goals and objectives or identify or prioritize the areas most important to achieving our goals, or we fail to effectively operate under our strategy in a way that minimizes disruptions to our business, it could materially and adversely affect our financial condition, results of operations, cash flows and stock price.
15 | | |||||||
Promoting and protecting our reputation and brand image is essential to our business success.
Our success depends on our ability to maintain and enhance our brands, expand to new geographies and new distribution platforms such as digital commerce, and evolve our portfolio with new product offerings that meet consumer needs and expectations.
We seek to strengthen our brands through investments in our product quality, product renovation, innovation and marketing investments, including consumer-relevant advertising, digital communication and consumer promotions. Actual or perceived failure to effectively address the continuing global focus on well-being, including changing consumer acceptance of certain ingredients, industrial manufacturing and processing, nutritional expectations of our products, the sustainability of our ingredients, our supply chain (including human rights and animal welfare issues) and our packaging (including plastic packaging and its ability to be recycled and other environmental impacts) could adversely affect our brands. Increased negative attention from the media, academics and online influencers, governments, shareholders and other stakeholders in these areas as well as on the role of food marketing, our response to political and social issues or catastrophic events, and other environmental, social, human capital or governance practices could adversely affect our brand image. Undue caution or our failure to react timely in addressing these challenges and trends could weaken our competitive position. Such pressures could also lead to stricter regulations, industry self-regulation that is unevenly adopted among companies, increased transparency in public disclosures, and increased focus on food and snacking, including marketing and labeling practices. Increasing and disparate legal or regulatory restrictions on our labeling, advertising and consumer promotions, or our response to those restrictions, could limit our efforts to maintain, extend and expand our brands. This includes regulations such as front-of-pack labeling and selective food taxes in multiple jurisdictions as well as age-based restrictions on sales of products with certain nutritional profiles. For example, in the United Kingdom, a ban on specific types of TV and online advertising of food containing levels of fat, sugar or salt above specified thresholds is expected to go into effect in October 2025, and new measures restricting certain promotions and in-store placement of some of those products recently went into effect. Moreover, adverse publicity, regulatory developments or legal action against us, our employees, licensees, or other actors in our supply chain related to product quality and safety, where and how we manufacture our products, environmental concerns including climate change and waste management, human and workplace rights across our supply chain, alleged health implications of certain food products or processing methods, labor relations, or antitrust, anti-bribery and anti-corruption compliance could damage our reputation and brand health. Such actions could undermine our customers’ and shareholders’ confidence and reduce demand for our products, even if the regulatory or legal action is unfounded or these matters are immaterial to our operations. Our product sponsorship relationships, including those with celebrity spokespersons, influencers or group affiliations, could also subject us to negative publicity.
In addition, our success in maintaining and enhancing our brand image depends on our ability to anticipate change and adapt to a rapidly changing marketing and media environment, including our increasing reliance on established and emerging social media and online platforms, digital and mobile dissemination of marketing and advertising campaigns, targeted marketing and the increasing accessibility and speed of dissemination of information. A variety of legal and regulatory restrictions as well as our own policies and participation in industry self-regulation initiatives limit how and to whom we market our products. These restrictions may limit our brand renovation, innovation, marketing and promotion plans, particularly as social media and the communications environment continue to evolve. The social media platforms we use to market our products may change their marketing rules or algorithms or may fall out of favor with certain consumer groups, and we may fail to effectively adapt our marketing strategies or may decide to no longer utilize certain platforms for marketing. We might also fail to sufficiently evolve our digital marketing efforts to effectively utilize consumer data. Negative posts or comments about Mondelēz International, our brands or our employees on social media or web sites (whether factual or not) or security breaches related to the use of our social media accounts and failure to respond effectively to these posts, comments or activities could damage our reputation and brand image across the various regions in which we operate. Placement of our advertisements in social media may also result in damage to our brands if the media itself experiences negative publicity. Our brands may be associated with or appear alongside harmful content including outputs from generative artificial intelligence models, before these platforms or our own social media monitoring can detect this risk to our brand. In addition, we might fail to invest sufficiently in maintaining, extending and expanding our brands, our marketing efforts might not achieve desired results and we might be required to recognize impairment charges on our brands or related intangible assets or goodwill. Third parties may sell counterfeit or imitation versions of our products that are inferior or pose safety risks. When consumers confuse these counterfeit products for our products or have a bad experience with the counterfeit brand, they might refrain from purchasing our brands in the future, which could harm our brand image and sales. Third parties might also improperly use our brands as part of phishing or other scams, which could negatively affect our brand image. Failure to successfully maintain and enhance our
16 | | |||||||
reputation and brand health could materially and adversely affect our company and product brands as well as our product sales, financial condition, results of operations, cash flows and stock price.
We must correctly predict, identify, interpret and meet changes in consumer preferences and demand and offer new and improved products that meet those changes.
Consumer preferences for food and snacking products change continually. Our success depends on our ability to predict, identify, interpret and meet the tastes, dietary habits, packaging, sales channel and other preferences of consumers around the world and to offer products that appeal to these preferences in the places and ways consumers want to shop. There may be further shifts in the relative size of shopping channels in addition to the increasing role of digital commerce for consumers. Our success relies upon managing this complexity to promote and bring our products to consumers effectively. Weak economic conditions, recessions, inflation, new or increased tariffs, and/or trade barriers, equity market volatility or other factors, such as global or local pandemics, severe or unusual weather events, and our response to political and social issues or catastrophic events, may affect consumer preferences and demand in ways that are hard to predict. Failure to offer, effectively promote and deliver products that appeal to consumers or to correctly judge consumer demand for our products will impact our ability to meet our growth targets, and our sales and market share could decrease and our profitability could suffer.
We must distinguish between short-term fads and trends and long-term changes in consumer preferences. Our sales can be adversely affected when we do not accurately predict which shifts in consumer preferences or category trends will be long-term or we fail to introduce new and improved products to satisfy changing preferences. In addition, because of our varied and geographically diverse consumer base, we must be responsive to local consumer needs, including with respect to when and how consumers snack and their desire for premium or value offerings. We must also provide an array of product formats, pack sizes and price points that satisfy the broad spectrum of consumer preferences and use marketing and advertising effectively to reach consumers at the right time with the right message. Increasing and disparate legal or regulatory restrictions on our labeling, advertising and consumer promotions, or our response to those restrictions, could limit our efforts to offer and deliver products that appeal to consumers. Likewise, new or increased tariffs and/or trade barriers and our response to these tariffs and barriers could limit our ability to offer and deliver our products on a cost-effective basis. Demand for our products could decrease and our profitability could suffer if we fail to expand and promote our product offerings successfully across product categories, rapidly develop products in faster growing and more profitable categories or reach consumers in efficient and effective ways leveraging data and analytics.
Negative perceptions concerning the health, environmental and social implications of certain food products, ingredients, packaging materials, and sourcing or production methods could influence consumer preferences and acceptance of some of our products and marketing programs. For example, consumers have increasingly focused on well-being, including reducing sodium and added sugar consumption or using weight-loss drugs to reduce consumption overall or change consumption patterns, as well as the source and authenticity of ingredients in the foods they consume. Continuing to focus on and expand our well-being offerings while refining the ingredient and nutrition profiles of existing products is important to our growth, as is maintaining focus on ethical sourcing and supply chain management opportunities to address evolving consumer preferences. In addition, consumer preferences differ by region, and we must monitor and adjust our use of ingredients and other activities to respond to these regional preferences. We might be unsuccessful in our efforts to effectively respond to changing consumer preferences and social expectations. Continued negative perceptions or failure to satisfy consumer preferences could materially and adversely affect our reputation, brands, product sales, financial condition, results of operations, cash flows and stock price.
Our operations in certain emerging markets expose us to political, economic and regulatory risks.
Our growth strategy depends in part on our ability to expand our operations in emerging markets, including among others Brazil, China, India, Mexico, Argentina, Eastern Europe, the Middle East, Africa and Southeast Asia. However, some emerging markets have greater political, economic and currency volatility and greater vulnerability to infrastructure and labor disruptions than more established markets. In many countries, particularly those with emerging economies, engaging in business practices prohibited by laws and regulations with extraterritorial reach, such as the FCPA and the U.K. Bribery Act, or local anti-bribery laws may be more common. These laws generally prohibit companies and their employees, contractors or agents from making improper payments to government officials, including in connection with obtaining permits or engaging in other actions necessary to do business. Failure to comply with these laws could subject us to civil and criminal penalties that could materially and adversely affect our reputation, financial condition, results of operations and stock price.
17 | | |||||||
In addition, competition in emerging markets is increasing as our competitors grow their global operations and low-cost local manufacturers improve and expand their production capacities. Our success in emerging markets is critical to achieving our growth strategy. Failure to successfully increase our business in emerging markets and manage associated political, economic and regulatory risks could adversely affect our product sales, financial condition, results of operations, cash flows and stock price.
Our use of information technology and third-party service providers exposes us to cybersecurity breaches and other business disruptions.
We use information technology and third-party service providers to support our global business processes and activities, including supporting critical business operations such as manufacturing and distribution; communicating with our suppliers, customers and employees; maintaining effective accounting processes and financial and disclosure controls; executing mergers and acquisitions and other corporate transactions; conducting research and development activities; meeting regulatory, legal and tax requirements; and executing various digital marketing and consumer promotion activities. Global shared service centers managed by third parties provide an increasing number of services important to conducting our business, including accounting, internal control, human resources and computing functions.
Continuity of business applications and services has been, and may in the future be, disrupted by events such as infection by viruses or malware; other cybersecurity attacks; issues with or errors in systems’ maintenance or security; power outages; hardware or software failures; denial of service attacks; telecommunication failures; natural disasters; terrorist attacks; and other catastrophic occurrences. Our use of new and emerging technologies such as cloud-based services and mobile applications continues to evolve, presenting new and additional risks in managing access to our data, relying on third parties to manage and safeguard data, ensuring access to our systems and availability of third-party systems. In addition, we are experiencing new and more frequent attempts by third parties to gain access to our systems, such as through increased email phishing of our workforce.
Our use of third-party technology and business services may expose us to cybersecurity breaches. These can include: (1) breaches of security systems, which could involve circumvention, denial-of-service attacks, or other cyberattacks such as hacking, phishing attacks, computer viruses, ransomware or malware, cyber extortion and (2) internal threats such as employee or insider errors, malfeasance, deepfake or social engineering schemes, physical breaches or other actions or attempts to exploit vulnerabilities. These threats could result in the misuse or breach of confidential information and Personally Identifiable Information belonging to us or our employees, customers, consumers, partners, suppliers, or government and regulatory authorities. Additionally, continued geopolitical turmoil, including the ongoing war in Ukraine and conflicts in the Middle East, has heightened the risk of cyberattacks. When risks such as these materialize, the need for us to coordinate with various third-party service providers and for third-party service providers to coordinate amongst themselves might increase challenges and costs to resolve related issues. Our information security program includes capabilities designed to evaluate and mitigate cyber risks arising from third-party service providers. Cyber threats to externally-hosted technology and business services are beyond our control. Additionally, new initiatives, such as those related to digital commerce and direct sales, that increase the amount of confidential information that we process and maintain increase our potential exposure to a cybersecurity breach. Furthermore, the rapid evolution and increased adoption of artificial intelligence technologies may intensify our cybersecurity risks. If our controls, disaster recovery and business continuity plans or those of our third-party providers do not effectively respond to or resolve the issues related to any such disruptions in a timely manner, our product sales, financial condition, results of operations and stock price may be materially and adversely affected, and we might experience delays in reporting our financial results, loss of intellectual property and damage to our reputation or brands.
We continue to invest and augment our cybersecurity program and posture with enhanced identity and access management solutions, multi-factor authentication, risk-based access for remote connectivity, privileged access management, network security, backup and disaster recovery, training and awareness, in addition to advance threat protection emanating from sophisticated, persistent and state-sponsored threat actors, including from internet browsing to email, further reducing our attack surface and likelihood of credential thefts and compromise. Further, we have 24/7 security operations, enhancing the monitoring and detection of threats in our environment, including the manufacturing environment and operational technologies, as well as adjusting information security controls based on our threat intelligence information. However, security measures cannot provide absolute security or guarantee that we will be successful in preventing or responding to every breach or disruption on a timely basis. Due to the constantly evolving and complex nature of cyber threat actors, we cannot predict the form and impact of
18 | | |||||||
any future incident, and the cost and operational expense of implementing, maintaining and enhancing protective measures to guard against increasingly complex and sophisticated cyber threats could increase significantly. Moreover, as cyberattacks increase in frequency and magnitude around the world, we may be unable to obtain cybersecurity insurance in the amounts and on terms we view as appropriate and favorable for our operations.
We transfer data across local, regional, and national borders to conduct our operations, and we are subject to a variety of continuously evolving and developing laws and regulations in numerous jurisdictions regarding privacy, data protection and data security, including those related to the collection, storage, handling, use, disclosure, transfer and security of personal data. Privacy and data protection laws may be interpreted and applied differently from jurisdiction to jurisdiction and may create inconsistent or conflicting requirements. For example, the European Union’s General Data Protection Regulation (“GDPR”) has greatly increased the jurisdictional reach of E.U. law, added a broad array of requirements for handling personal data including the public disclosure of significant data breaches, and imposes substantial penalties for non-compliance of up to 4% of global annual revenue for the preceding financial year in addition to potential restrictions on data transfer and processing. Our efforts to comply with multijurisdictional privacy and data protection laws and the uncertainty of new laws and regulations will likely increase the complexity of our processes and may impose significant costs and challenges that are likely to increase over time, and we could incur substantial penalties or be subject to litigation related to violation of existing or future data privacy laws and regulations.
We are subject to risks from unanticipated business disruptions.
We manufacture and source products and materials on a global scale. We utilize an interdependent supply chain – a complex network of suppliers and material needs, owned and leased manufacturing locations, external manufacturing partners, distribution networks, shared service delivery centers and information systems that support our ability to provide our products to our customers consistently. Factors that are hard to predict or beyond our control, like weather, natural disasters, water and energy availability, supply and commodity shortages, port congestions or delays, transport capacity constraints, terrorism, political unrest or armed hostilities (including the ongoing war in Ukraine and conflicts in the Middle East), cybersecurity incidents, labor shortages, strikes or work stoppages, new or increased tariffs and/or trade barriers, operational and/or financial instability of our key suppliers and other vendors or service providers, government shutdowns or health pandemics, including any potential impact of climate change on these factors, could damage or disrupt our operations or those of our suppliers, their suppliers, our external manufacturing partners, distributors or other business partners. Failure to effectively prepare for and respond to disruptions in our operations, for example, by not finding alternative suppliers or replacing capacity at key or sole manufacturing or distribution locations or by not quickly repairing damage to our information, production or supply systems, can cause delays in delivering or the inability to deliver products to our customers, and the quality and safety of our products might be negatively affected. Moreover, disputes with significant customers or suppliers, including disputes regarding pricing or performance, could adversely affect our sales, financial condition, and results of operations. The occurrence of a material or extended disruption may cause us to lose our customers’ or business partners’ confidence or suffer damage to our reputation, and long-term consumer demand for our products could decline. We use insurance to transfer our financial risk related to these exposures, but some of the risks we face are difficult or impossible to insure and the timing of insurance recoveries may not match the timing of the financial loss we incur. We are subject to risk related to operational safety, including risk of fire, explosion or accidental contamination. We could also fail to achieve our strategic objectives due to capability or technology deficiencies related to our ongoing reconfiguration of our supply chain to drive efficiencies and fuel growth. Further, our ability to supply multiple markets with a streamlined manufacturing footprint may be negatively impacted by portfolio complexity, significant changes in trade policies, changes in volume produced and changes to regulatory restrictions or labor-related or other constraints on our ability to adjust production capacity in the markets in which we operate. These events could materially and adversely affect our product sales, financial condition, results of operations, cash flows and stock price.
We may not successfully identify, complete or manage strategic transactions.
We regularly evaluate a variety of potential strategic transactions globally, including acquisitions, divestitures, joint ventures, equity method investments and other strategic alliances that could further our strategic business objectives, and acquisitions and joint ventures are an important part of our strategy to increase our exposure to fast-growing snacking segments, fill geographic white spaces and expand into adjacent categories. For example, in 2024 we sold our remaining equity investment in JDE Peet’s N.V. and acquired Evirth (Shanghai) Industrial Co., Ltd. In 2023, we completed the sale of our developed market gum business in the United States, Canada and Europe and sold our remaining equity investment in Keurig Dr Pepper Inc., and in 2022 we acquired Chipita Global S.A.,
19 | | |||||||
Clif Bar & Company and Ricolino. Such transactions and investments present significant challenges and risks. We may not successfully identify potential strategic transactions to pursue, may not have counterparties willing to transact with us, or we may not successfully identify or manage the risks presented by these strategic transactions, or complete such transactions. Our success depends, in part, upon our ability to identify suitable transactions; negotiate favorable contractual terms; comply with applicable regulations and receive necessary consents, clearances and approvals (including regulatory and antitrust clearances and approvals that may face increased scrutiny); integrate or separate businesses; manage or achieve performance of ESG goals and initiatives; realize the full extent of the benefits, cost savings or synergies presented by strategic transactions; offset loss of revenue associated with divested brands or businesses; effectively implement control environment processes; minimize adverse effects on existing business relationships with suppliers and customers; achieve accurate estimates of fair value; minimize potential loss of customers or key employees; and minimize indemnities and potential disputes with buyers, sellers and strategic partners. In addition, execution or oversight of strategic transactions may result in the diversion of management attention from our existing business and may present financial, managerial and operational risks.
With respect to acquisitions and joint ventures in particular, we are also exposed to potential risks based on our ability to conform standards, controls, policies and procedures, and business cultures; consolidate and streamline operations and infrastructures; identify and eliminate, as appropriate, redundant and underperforming operations and assets; manage inefficiencies associated with the integration of operations; and coordinate timely and ongoing compliance with applicable laws, including antitrust and competition, anti-bribery and corruption and import/export laws. Equity investments and other strategic alliances pose additional risks, as we could share ownership in both public and private companies and in some cases management responsibilities with one or more other parties whose objectives for the alliance may diverge from ours over time, who may not have the same priorities, strategies or resources as we do, or whose interpretation of applicable policies may differ from our own. Transactions or ventures into which we enter might not meet our financial and non-financial control and compliance expectations or yield the anticipated benefits. Depending on the nature of the business ventures, including whether they operate globally, these ventures could also be subject to many of the same risks we are, including political, economic, regulatory and compliance risks, currency exchange rate fluctuations, and volatility of commodity and other input prices.
Furthermore, we may not be able to complete, on terms favorable to us, desired or proposed divestitures of businesses that do not meet our strategic objectives or our growth or profitability targets. Our divestiture activities, or related activities such as reorganizations, restructuring programs and transformation initiatives, may require us to provide or receive transitional support and/or ongoing commercial relationships, recognize impairment charges or take action to reduce costs that remain after we complete a divestiture. Gains or losses on the sales of, or lost operating income from, those businesses may also affect our profitability. Any of these risks could materially and adversely affect our business, product sales, financial condition, results of operations, cash flows and stock price.
Macroeconomic and Industry Risks
Our business is subject to an increasing focus on sustainability matters.
We have announced, and may from time to time announce, certain initiatives, including goals, targets and other objectives, related to sustainability matters. These statements reflect our current plans and do not constitute a guarantee that they will be achieved. Our efforts to research, establish, accomplish, and accurately report on these goals, targets and other objectives expose us to numerous operational, reputational, financial, legal and other risks. Our ability to achieve any stated goal, target or objective is subject to numerous factors and conditions, many of which are outside of our control. Examples of such factors include evolving regulatory requirements affecting sustainability standards or disclosures or imposing different requirements, the reliance on other value chain actors to implement the required changes, the pace of changes in technology and the availability of suppliers that can meet our sustainability and other standards. In addition, statements about our sustainability goals, targets and other objectives, and progress against those goals, targets and other objectives, may be based on standards for measuring progress that are still developing, internal controls and processes that continue to evolve and assumptions that are subject to change in the future. Our selection of voluntary disclosure frameworks and standards, and the interpretation or application of those frameworks and standards, may change from time to time or differ from those of others. Methodologies for reporting this data may be updated and previously reported data may be adjusted to reflect improvement in availability and quality of third-party data, changing assumptions, changes in the nature and scope of our operations, and other changes in circumstances, which could result in significant revisions to our current goals, reported progress in achieving such goals, or ability to achieve such goals in the future. Further, developing and collecting, measuring and reporting ESG-related information and metrics can
20 | | |||||||
be costly, difficult and time consuming and is subject to evolving reporting standards, including recent legislation in California related to reporting greenhouse gas emissions and climate-related financial risk, the SEC’s climate-related reporting requirements, and similar proposals by other international regulatory bodies such as the Corporate Sustainability Reporting Directive in the European Union, especially to the extent these standards are not harmonized or consistent.
Our business may face increased scrutiny from the investment community, customers, consumers, employees, activists, media, regulators and other stakeholders related to our sustainability initiatives, including the goals, targets and objectives that we announce, and our methodologies and timelines for pursuing them. At the same time, stakeholders and regulators have increasingly expressed or pursued opposing views, legislation and investment expectations with respect to sustainability initiatives, including the enactment or proposal of “Anti-ESG” legislation or policies. If our sustainability practices do not meet evolving investor or other stakeholder expectations and standards or if we are unable to satisfy all stakeholders, our reputation, our ability to attract or retain employees, our sales and our attractiveness as an investment, business partner or as an acquiror could be negatively impacted. Similarly, our failure or perceived failure to pursue or fulfill our goals, targets and objectives, to comply with ethical, environmental or other standards, regulations or expectations, or to satisfy various reporting standards with respect to these matters, within the timelines we announce, or at all, could have the same negative impacts, as well as expose us to government enforcement actions, fines and private litigation. Even if we achieve our goals, targets and objectives, we may not realize all of the benefits that we expected at the time they were established.
Climate change might adversely impact our supply chain or our operations.
Scientific evidence collected by the Intergovernmental Panel on Climate Change demonstrates that carbon dioxide and other greenhouse gases in the atmosphere have caused and will in the future cause changes in weather patterns around the globe that expose us to physical and transition risk. Physical risks include the increasing frequency of extreme weather events and natural disasters and effects on water availability and quality and biodiversity loss. These impacts increase risks to the global food production and distribution system and to the safety and resilience of the communities where we live, work and source our ingredients, and could further decrease food security for communities around the world. Decreased agricultural productivity caused by climate change has limited and in the future may continue to limit the availability of the commodities we purchase and use and increase the costs of such products. These include cocoa, which is a critical raw material for our chocolate and biscuits & baked snacks portfolios that is particularly sensitive to changes in climate and has recently had a global decrease in availability and increase in price, as well as other raw materials such as dairy, wheat, vegetable oils, sugar and nuts. Weather events such as floods, severe storms or water shortages that are partially caused or exacerbated by climate change might disrupt our business operations or those of our suppliers, their suppliers, our external manufacturing partners, distributors or other business partners and could increase our insurance and other operating costs.
Transition risks include increased focus by federal, state and local regulatory and legislative bodies globally regarding environmental policies relating to climate change, regulating greenhouse gas emissions (including carbon pricing or a carbon tax), energy policies, disclosure obligations and sustainability (including single use plastics). New legal and regulatory requirements have increased and could continue to increase our operating costs for things like energy or packaging through taxes or regulations, including payments under extended producer responsibility policies, taxes on specific packaging material types and targets to increase the use of reuse/refill delivery models. Regulations intended to reduce carbon emissions, including any actual or proposed carbon taxes, could also substantially increase our product supply chain and distribution costs. Even if we make changes to align ourselves with such legal or regulatory requirements, we may still be subject to significant penalties or potential litigation if such laws and regulations are interpreted and applied in a manner inconsistent with our practices. Similarly, we may incur substantial costs if such legal or regulatory requirements are subsequently reversed or modified. Concern about climate change might cause consumer preferences to switch away from products or ingredients considered to have high climate change impact and towards products that are more sustainably grown and made. We expect to incur additional costs as we evolve our portfolio and engage in due diligence, verification and reporting in connection with our ESG and sustainability initiatives. We might not effectively address increased attention from the media, shareholders, activists and other stakeholders on climate change and related environmental sustainability matters, including deforestation, land use, water use and packaging, including plastic. Those stakeholders might also have requests or proposals that are not aligned with the focus of our efforts on climate change and ESG matters. Climate change-related impacts could also reduce demand for our products. If costs for raw materials increase or availability decreases, we raise prices for our products and our competitors respond differently to those
21 | | |||||||
cost or availability pressures, demand for our products and our market share could suffer. We have also experienced decreased demand for chocolate during periods when temperatures are warmer.
In 2021, we announced our goal of net zero greenhouse gas emissions by 2050. Achieving this goal will require significant transformation of our business, capital investment and the development of technology that might not currently exist. We might incur significant additional expenses or be required to recognize impairment charges in connection with our efforts, and we might be unable to achieve, or be perceived to fail to achieve, our goal. Any or all of these risks could materially and adversely affect our ability to meet the needs of our customers, reputation, product sales, financial condition, results of operations, cash flows and stock price.
Our retail customers are consolidating, and we must offer an effective value proposition in order to compete against retailer and other economy brands.
Retail customers, such as supermarkets, discounters, digital commerce merchants, warehouse clubs and food distributors in the European Union, the United States and other major markets, continue to consolidate, form buying alliances or be acquired by new entrants in the food retail market, resulting in fewer, larger customers. Large retail customers and customer alliances can delist our products or reduce the shelf space allotted to our products and demand lower pricing, increased promotional programs or longer payment terms. Retail customers might also adopt these tactics in their dealings with us in response to the significant growth in online retailing for consumer products, which is outpacing the growth of traditional retail channels. The growth of alternative online retail channels, such as direct-to-consumer and electronic business-to-business, may adversely affect our relationships with our large retail and wholesale customers.
In addition, larger retail customers have the scale to develop supply chains that permit them to operate with reduced inventories or to develop and market their own retailer and other economy brands that compete with some of our products. Our products must provide higher quality or value to our consumers than the less expensive alternatives, particularly during periods of economic uncertainty, recessions or significant inflation. Consumers may not buy our products if they perceive little difference between the quality or value of our products and those of retailer or other economy brands. If consumers prefer or otherwise choose to purchase the retailer or other economy brands, we can lose market share or sales volumes, or we may need to shift our product mix to lower margin offerings.
Retail consolidation also increases the risk that adverse changes in our customers’ business operations or financial performance will have a corresponding material adverse effect on us. For example, if our customers cannot access sufficient funds or financing, then they may delay, decrease or cancel purchases of our products, or delay or fail to pay us for previous purchases. Failure to effectively respond to retail consolidation, increasing retail power and competition from retailer and other economy brands could materially and adversely affect our reputation, brands, product sales, financial condition, results of operations, cash flows and stock price.
We are subject to changes in our relationships with significant customers, suppliers and distributors.
During 2024, no single customer accounted for more than 10% of our net revenues. However, there can be no assurance that our customers will continue to purchase our products in the same mix or quantities or on the same terms as in the past, particularly as increasingly powerful retailers continue to demand lower pricing and develop their own brands. The loss of or disruptions related to a significant customer could result in a material reduction in sales or change in the mix of products we sell to the customer. This could materially and adversely affect our product sales, financial condition, results of operations, cash flows and stock price.
Disputes with significant customers, suppliers or distributors, including disputes related to pricing or performance and any resultant refusal to provide shelf and/or retail spaces for our products, could adversely affect our ability to supply or deliver products or operate our business and could materially and adversely affect our product sales, financial condition and results of operations. The financial condition of our significant customers and business partners are affected by events that are largely beyond our control. New regulations can also affect our commercial practices and our relationship with customers, suppliers or distributors. Deterioration in the financial condition of significant customers, suppliers or distributors or regulations affecting our relationship with these parties could materially and adversely affect our product sales, financial condition, results of operations, cash flows and stock price.
22 | | |||||||
We may be unable to hire or retain and develop key personnel or a highly skilled and diverse global workforce or effectively manage changes in our workforce and respond to shifts in labor availability.
We must attract, hire, retain and develop effective leaders and a highly skilled and diverse global workforce. We compete to hire new personnel with a variety of capabilities in the many countries in which we manufacture and market our products and then to develop and retain their skills and competencies. We have experienced and could continue to experience unplanned or increased turnover of employees with key capabilities, and we could fail to develop adequate succession plans for leadership positions or hire and retain a workforce with the skills and in the locations we need to operate and grow our business. We could also fail to attract and develop personnel with key emerging capabilities that we need to continue to respond to changing consumer and customer needs and grow our business, including skills in the areas of advanced technology, artificial intelligence, machine learning, digital commerce, data analytics and supply chain expertise. Occurrence of any of these conditions could deplete our institutional knowledge base and erode our competitiveness.
We are experiencing an increasingly tight and competitive labor market and could face unforeseen challenges in the availability of labor. A sustained labor shortage or increased turnover rates within our employee base as a result of general macroeconomic factors (including high inflation and hyperinflation in certain markets), have led and in the future could continue to lead to increased costs, such as increased overtime to meet demand and increased wages to attract and retain employees. We have also been negatively affected and could continue to be negatively affected by labor shortages or constraints experienced by our partners, including our external manufacturing partners, freight providers, other strategic suppliers and distributors. Failure to achieve and maintain a diverse workforce and leadership team, compensate our employees competitively and fairly, maintain a safe and inclusive environment or promote the well-being of our employees could affect our reputation and also result in lower performance and an inability to retain valuable employees.
We must address changes in, and that affect, our workforce and satisfy the legal requirements associated with how we manage and compensate our employees. This includes our management of employees represented by labor unions or workers’ councils, who represent approximately 60% of our 78,000 employees outside the United States and approximately 20% of our 12,000 U.S. employees. Strikes, work stoppages or other forms of labor unrest by our employees or those of our suppliers, distributors or other business partners, or situations like the renegotiation of collective bargaining agreements, have in the past and may in the future cause disruptions to our supply chain, manufacturing or distribution processes. Changes in immigration laws and policies or restrictions could make it more difficult for us to recruit or relocate skilled employees. We could also fail to effectively respond to evolving perceptions and goals of those in our workforce or whom we might seek to hire with respect to flexible working or other matters. These risks could materially and adversely affect our reputation, ability to efficiently operate our manufacturing facilities and overall business and meet the needs of our customers, product sales, financial condition, results of operations, cash flows and stock price.
Legal and Regulatory Risks
We face risks related to complying with changes in and inconsistencies among laws and regulations in many countries in which we operate.
Our activities around the world are highly regulated and subject to government oversight. Various laws and regulations govern food production, sourcing, packaging and waste management (including packaging containing PFAS), storage, distribution, sales, advertising, labeling and marketing, as well as intellectual property, competition, antitrust, trade and export controls, labor, tax, social and environmental matters, privacy, data protection, and health and safety practices. Government authorities regularly change laws and regulations, their interpretations of existing laws and regulations, and their enforcement priorities. Our failure to comply with existing laws and regulations (or allegations thereof), or to make changes necessary to comply with new or revised laws and regulations or evolving interpretations and application of existing laws and regulations, and differing or competing laws and regulations across the markets where our products are made, manufactured, distributed and sold, could materially and adversely affect our product sales, financial condition, results of operations and cash flows, including as a result of higher compliance costs, higher capital expenditures and higher production costs. For instance, our financial condition, results of operations and cash flows could be negatively affected by the regulatory and economic impact of changes in the corporate tax policies of the United States and other countries; tariff policies and trade relations among the United States and other countries, including China, Mexico, Canada and the European Union; and changes within the European Union. Evolving expectations on ESG disclosures and reporting will also result in new regulatory actions. In addition, the results of third-party studies (whether or not scientifically valid) purporting to
23 | | |||||||
assess the health implications of consumption of certain ingredients or substances present in certain of our products or packaging materials have resulted in and could continue to result in our being subject to new taxes and regulations or lawsuits that can adversely affect our business.
We may decide or be required to recall products or be subjected to product liability claims or litigation.
We could decide, or laws or regulations could require us, to recall products due to suspected or confirmed deliberate or unintentional product contamination, including contamination of ingredients we use in our products that third parties supply, spoilage or other adulteration, the introduction of foreign objects, food-borne illnesses, product mislabeling or product tampering. These risks could be heightened in light of increased pressure on our suppliers from supply chain challenges. In addition, if another company recalls or experiences negative publicity related to a product in a category in which we compete, consumers might reduce their overall consumption of products in this category. Any of these events could materially and adversely affect our reputation, brands, product sales, financial condition, results of operations, cash flows and stock price.
We may also suffer losses when our products or operations or those of our suppliers violate applicable laws or regulations, or when our or our suppliers’ products cause injury, illness or death. In addition, our marketing could face claims of false or deceptive advertising or other criticism. A significant product liability or related claim or other legal judgment against us, a regulatory enforcement action, a widespread product recall or comments relating to the safety of our products could materially and adversely affect our reputation and profitability. Moreover, even if a product liability, consumer fraud or other claim, litigation or investigation has no merit, is not pursued or is unsuccessful, the negative publicity surrounding assertions against our products or processes or conduct could materially and adversely affect our reputation, brands, product sales, product inventory, financial condition, results of operations, cash flows and stock price, and we could incur significant expense responding to such a claim, litigation or investigation. For example, a recent purported personal injury lawsuit filed against a number of food companies, including us (Bryce Martinez vs. Kraft Heinz Co. Inc. et al.), alleged that certain food products we and other companies make are addictive and cause health problems. While we believe that this lawsuit is without merit and intend to vigorously defend ourselves, we cannot predict the outcome or the impact of such litigation or similar lawsuits on our business or reputation. In addition, while we currently maintain insurance coverage that, subject to its terms and conditions, is intended to address costs associated with certain aspects of product recalls, this insurance coverage may not, depending on the specific facts and circumstances surrounding an incident, cover all losses or all types of claims that arise from an incident, or the damage to our reputation or brands that may result from an incident.
We face risks related to legal or tax claims, litigation, investigations or other regulatory enforcement actions.
We operate around the world in environments with constantly evolving legal, tax and regulatory frameworks, and we are subject to risk of litigation, legal or tax claims, investigations, or other regulatory enforcement actions. Actions by our employees, contractors, agents or others in violation of our policies and procedures could lead to deficiencies in our internal or other controls or violations, unintentional or otherwise, of laws and regulations. We could also be subject to litigation, legal claims, investigations or regulatory actions in connection with the continued evolution of our sustainability and ESG-related initiatives. In addition, we may be impacted by litigation trends, including class action, individual or multi-jurisdiction lawsuits, or investigations or enforcement actions involving consumers, employees, shareholders or other stakeholders. For example, as a global snacking company, we are subject to increased regulatory scrutiny and face legal challenges in a variety of jurisdictions concerning the alleged health implications of certain food products and our methods in marketing those products. When litigation, legal or tax claims, investigations or regulatory enforcement actions arise out of our failure or alleged failure to comply with applicable laws, regulations or controls, we could be subject to civil and criminal penalties, and voluntary and involuntary document requests, that could materially and adversely affect our reputation, product sales, financial condition, results of operations, cash flows and stock price. Even if a claim, lawsuit, investigation, enforcement action or other action is unsuccessful, without merit or not pursued to completion, the reputational impact or cost of responding to such a claim, including expenses and management time, could adversely affect us.
We face risks related to adequately protecting our valuable intellectual property rights.
We consider our intellectual property rights, particularly and most notably our trademarks, but also our patents, copyrights, registered designs, proprietary trade secrets, recipes, technology, know-how and licensing agreements, to be a significant and valuable part of our business. We attempt to protect our intellectual property rights by taking
24 | | |||||||
advantage of a combination of patent, trademark, copyright and trade secret laws in various countries, as well as licensing agreements, third-party nondisclosure and assignment agreements and policing of third-party misuses and infringement of our intellectual property in traditional retail and digital environments. Our failure to obtain or adequately protect our intellectual property rights (including in response to developments in artificial intelligence technologies), or any change in law or other changes that serve to lessen or remove the current legal protections of our intellectual property, may diminish our competitiveness and could materially harm our business, financial condition and stock price.
We may be unaware of potential third-party claims of intellectual property infringement relating to our technology, brands or products. Any litigation regarding patents or other intellectual property could be costly and time-consuming and could divert management’s and other key personnel’s attention from our business operations. Third-party claims of intellectual property infringement might require us to pay monetary damages or enter into costly license agreements. We also may be subject to injunctions against development and sale of certain of our products, which could include removal of existing products from sale. Any of these occurrences could materially and adversely affect our reputation, brand health, ability to introduce new products or improve the quality of existing products, product sales, financial condition, results of operations, cash flows and stock price.
Financial Risks
We face risks related to tax matters, including changes in tax laws and rates, disagreements with taxing authorities and imposition of new taxes.
As a global company, we are subject to taxation in the United States and various other countries and jurisdictions. As a result, our effective tax rate is determined based on the income and applicable tax rates in the various jurisdictions in which we operate. Our future effective tax rates could be affected by changes in the composition of earnings in countries with differing tax rates or other factors, and adverse changes in the underlying profitability or financial outlook of our operations could lead to changes in the realizability of our deferred tax assets, resulting in a charge to our effective tax rate.
Changes in tax laws in the U.S. or in other countries where we have significant operations, including rate changes or corporate tax provisions that could disallow or tax perceived base erosion or profit shifting payments or subject us to new types of tax, could materially affect our effective tax rate and our deferred tax assets and liabilities. As of January 2025, the change in U.S. presidential administration and control of U.S. Congress may produce changes to U.S. tax legislation. In addition, aspects of U.S. tax laws may lead foreign jurisdictions to respond by enacting additional tax legislation that is unfavorable to us. As of December 31, 2024, numerous countries have now enacted the Organization of Economic Cooperation and Development’s model rules on a global minimum tax, with the earliest effective date being for taxable years beginning after December 31, 2023. Important details of these minimum tax regimes are still being considered. Based on the guidance available thus far, we do not expect this legislation to have a material impact on our consolidated financial statements, but we will continue to evaluate it as additional guidance and clarification becomes available.
We are also subject to tax audits by governmental authorities. Although we believe our tax estimates are reasonable, if a taxing authority disagrees with the positions we have taken, we could face additional tax liabilities, including interest and penalties. Unexpected results from one or more such tax audits could significantly adversely affect our effective tax rate, results of operations, cash flows and stock price.
We are subject to currency exchange rate fluctuations.
As of December 31, 2024, we sold our products in over 150 countries and had operations in approximately 80 countries. Consequently, a significant portion of our business is exposed to currency exchange rate fluctuations. Our financial position and operating results are sensitive to movements in currency exchange rates, which have recently been more volatile, because a large portion of our assets, liabilities, revenue and expenses must be translated into U.S. dollars for reporting purposes or converted into U.S. dollars to service obligations such as our U.S. dollar-denominated indebtedness and to pay dividends to our shareholders. In addition, movements in currency exchange rates affect transaction costs because we source product ingredients from various countries. Our efforts to mitigate our exposure to exchange rate fluctuations, primarily on cross-currency transactions, may not be successful. We factor exchange rate impacts into our local pricing decisions, but there may be lags in implementing pricing changes due to competitive pressures or customer or regulatory constraints. We also hedge a number of risks including exposures to foreign exchange rate movements and volatility of interest rates that could
25 | | |||||||
impact our future borrowing costs. Hedging of these risks could potentially subject us to counter-party credit risk. In addition, local economies, monetary policies and currency hedging availability affect our ability to hedge against currency-related economic losses. We might not be able to successfully mitigate our exposure to currency risks due to factors such as continued global and local market volatility, actions by foreign governments, trade disputes, economic sanctions, political uncertainty, inflation, interest rates and limited hedging opportunities. For instance, in December 2023, the Argentinean peso devalued significantly in excess of historic levels. Accordingly, changes in the currency exchange rates that we use to translate our results into U.S. dollars for financial reporting purposes or for transactions involving multiple currencies could materially and adversely affect future demand for our products, our financial condition, results of operations, cash flows and stock price, and our relationships with customers, suppliers and employees in the short or long-term.
Weak financial performance, downgrades in our credit ratings, illiquid global capital markets and volatile global economic conditions could limit our access to short-term financing, reduce our liquidity and/or increase our borrowing costs.
We regularly access the commercial paper markets in the United States and Europe for ongoing funding requirements. A downgrade in our credit ratings by a credit rating agency could increase our borrowing costs and adversely affect our ability to issue commercial paper. Disruptions in the global commercial paper market or other effects of volatile economic conditions on the global credit markets also could reduce the amount of commercial paper that we could issue and raise our borrowing costs for both short- and long-term debt offerings. Additionally, we use cash management programs, such as factoring and supply chain finance arrangements, in our business when circumstances are favorable to manage liquidity. If these programs or underlying customer or supplier terms do not continue and we are unable to secure alternative programs, our cash and working capital may be negatively affected and we may have to utilize our various financing arrangements or increase our long-term borrowings for short- and long-term liquidity requirements. Limitations on our ability to access the commercial paper markets, a reduction in our liquidity or an increase in our borrowing costs could materially and adversely affect our financial condition, results of operations and stock price.
Volatility in the global capital markets, interest rates, inflation rates, our participation in multiemployer pension plans and other factors could increase our costs relating to our employees’ pensions.
We sponsor defined benefit pension plans for a number of our employees throughout the world and also contribute to other employees’ pensions under defined benefit plans that we do not sponsor. At the end of 2024, the projected benefit obligation of the defined benefit pension plans we sponsor was $7.9 billion and plan assets were $8.5 billion.
For defined benefit pension plans that we maintain, the difference between plan obligations and assets, or the funded status of the plans, significantly affects the net periodic benefit costs of our pension plans and the ongoing funding requirements of those plans. Our largest funded defined benefit pension plans are funded with trust assets invested in a globally diversified portfolio of investments, including equities and corporate and government debt. Among other factors, changes in interest rates, inflation rates, mortality rates, early retirement rates, investment returns, funding requirements in the jurisdictions in which the plans operate and the market value of plan assets affect the level of plan funding, cause volatility in the net periodic pension cost and impact our future funding requirements. Legislative and other governmental regulatory actions may also increase funding requirements for our pension plan benefit obligations. Volatility in the global capital markets may increase the risk that we will be required to make additional cash contributions to these company-sponsored pension plans and recognize further increases in our net periodic pension cost.
We also participate in multiemployer pension plans for certain U.S. union-represented employees. As a participating employer under multiemployer pension plans, we may owe more than the contributions we are required to make under the applicable collective bargaining agreements. For example, if we partially or completely withdraw from a multiemployer pension plan, we may be required to pay a partial or complete withdrawal liability, such as the withdrawal liability we are paying in connection with our complete withdrawal from the Bakery and Confectionery Union and Industry International Pension Fund in 2018. This kind of withdrawal liability will generally increase if there is also a mass withdrawal of other participating employers or if the plan terminates. See Note 11, Benefit Plans, to the consolidated financial statements for more information on our multiemployer pension plans.
A significant increase in our pension benefit obligations, future funding requirements or net periodic benefit costs could curtail our ability to invest in the business and adversely affect our financial condition, results of operations, cash flows and stock price.
26 | | |||||||
Item 1B. Unresolved Staff Comments.
None.
Item 1C. Cybersecurity.
We are committed to our goal to protect sensitive business-related and personal information, as well as our information systems. Due to the size and scope of our global operations, we are subject to numerous and evolving cybersecurity risks that could adversely and materially affect our business, financial condition and results of operations.
Our Management Leadership Team, with oversight from the Board of Directors, has implemented a comprehensive cybersecurity program, including incident response process, aligned with the National Institute of Standards and Technology (NIST) Cybersecurity Framework and NIST Computer Security Incident Handling Guide (NIST SP 800-61) to assess, identify, address and manage risks from cybersecurity threats that may result in material adverse effects on the confidentiality, integrity and availability of our business and information systems.
Governance
Our Board of Directors and Management Leadership Team review cybersecurity risks as part of their oversight and execution of the Company’s business operations and strategy. We have established oversight mechanisms intended to provide effective cybersecurity governance, risk management, and timely incident response.
Board of Directors Oversight
Our Board, in coordination with the Audit Committee, oversees the Company’s enterprise risk management process, including the management of risks arising from cybersecurity threats. Our Board has delegated the primary responsibility to oversee cybersecurity matters to the Audit Committee. Both the Board and the Audit Committee periodically review the measures we have implemented to identify and mitigate data protection and cybersecurity risks.
Management Role in Cybersecurity Risk Management
Cybersecurity Steering Committee
Our Cybersecurity Steering Committee currently includes our CEO, CFO, CISO, General Counsel and Chief Ethics & Compliance Officer and has broad oversight of our cybersecurity risk management processes, in coordination with the rest of the Management Leadership Team and the Board. The Cybersecurity Steering Committee has been established to meet and to discuss our cybersecurity risk management measures designed to identify and mitigate
27 | | |||||||
data protection and cybersecurity risks, along with procedures and practices related to incident response, including escalation and notification.
Risk Management and Strategy
We assess, identify, and manage risks from cybersecurity threats through various mechanisms, which may include tabletop exercises to test our preparedness and incident response process, business unit assessments, control gap analyses, threat modeling, penetration tests, vulnerability scanning, internal audits, and external audits of our cybersecurity program. We also leverage assessors, consultants, auditors and third-party service providers, including threat intelligence to inform our understanding of the cybersecurity threat landscape and enable risk-based measures to defend against evolving threats.
Incident Response
We have a Cybersecurity Incident Response Plan (“CSIRP”) to provide the organizational and operational structure, processes, and procedures for investigating, containing, documenting and mitigating cybersecurity incidents, including keeping senior management and other key stakeholders informed and involved as appropriate.
Our Cybersecurity Incident Response Team manages and executes technical response activities in coordination with our Security Operations Center, subject matter experts and others to respond to a cybersecurity incident. The objectives of the CSIRP include to:
•Establish the Company’s cybersecurity incident response process and provide actionable guidelines to provide a timely, consistent, and repeatable response process;
•Describe the requirements and expectations for cybersecurity incident response;
•Set forth the roles and responsibilities for cybersecurity incident response personnel;
•Establish cybersecurity incident classification, escalation, and prioritization parameters;
•Confirm the documentation process for cybersecurity incidents affecting the Company and the Company’s responses are appropriately documented;
•Establish protocols for materiality determinations for cybersecurity incidents under the SEC’s cybersecurity rules;
•Establish the process for assessing when public disclosure and external communications may be required; and
•Mitigate or minimize the effects of a cybersecurity incident on the Company, its personnel, customers, consumers, or others and limit financial, operational, legal, and reputational impact.
Material Cybersecurity Risks, Threats & Incidents
We also rely on information technology and third-party vendors to support our operations, including our secure processing of personal, confidential, sensitive, proprietary and other types of information. Despite ongoing efforts to continuously improve our and our vendors’ ability to protect against cyber incidents, we may not be able to protect all information systems, and such incidents may lead to reputational harm, revenue and client loss, legal actions, statutory penalties, among other consequences. While we have not experienced a known material information security breach nor incurred material breach-related expenses over the last three years, there can be no guarantee that we will not be the subject of future cybersecurity threats or incidents. Additional information on cybersecurity risks we face can be found in Item 1A, Risk Factors, which should be read in conjunction with the foregoing information.
28 | | |||||||
Item 2. Properties.
On December 31, 2024, we had approximately 147 manufacturing and processing facilities in 46 countries and 107 principal distribution centers and warehouses worldwide that we owned or leased. In addition to our owned or leased properties, we also utilize a highly distributed network of warehouses and distribution centers that are owned or leased by third party logistics partners, contract manufacturers, co-packers or other strategic partners. We believe we have or will add sufficient capacity to meet our planned operating needs. It is our practice to maintain all of our plants and other facilities in good condition.
| As of December 31, 2024 | |||||||||||
Manufacturing Facilities | Distribution and Warehouse Facilities | ||||||||||
Latin America (1) | 17 | 16 | |||||||||
| AMEA | 48 | 24 | |||||||||
| Europe | 61 | 6 | |||||||||
| North America | 21 | 61 | |||||||||
| Total | 147 | 107 | |||||||||
| Owned | 123 | 13 | |||||||||
| Leased | 24 | 94 | |||||||||
| Total | 147 | 107 | |||||||||
(1)Excludes our deconsolidated Venezuela operations. Refer to Note 1, Summary of Significant Accounting Policies, for more information.
Item 3. Legal Proceedings.
Information regarding legal proceedings is available in Note 14, Commitments and Contingencies, to the consolidated financial statements in this report.
Item 4. Mine Safety Disclosures.
Not applicable.
29 | | |||||||
PART II
Item 5. Market for Registrant’s Common Equity, Related Stockholder Matters and Issuer Purchases of Equity Securities.
We are proud members of the Standard and Poor’s 500 and Nasdaq 100. Our Common Stock is listed on The Nasdaq Global Select Market under the symbol “MDLZ.” At January 31, 2025, there were 34,057 holders of record of our Common Stock.
Comparison of Five-Year Cumulative Total Return
The following graph compares the cumulative total return on our Common Stock with the cumulative total return of the S&P 500 Index and the Mondelēz International performance peer group index. The graph assumes, in each case, that an initial investment of $100 is made at the beginning of the five-year period. The cumulative total return reflects market prices at the end of each year and the reinvestment of dividends each year.
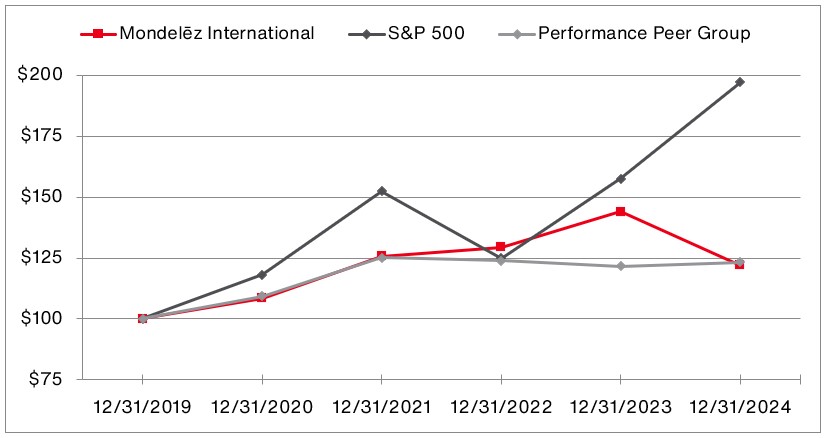
| As of December 31, | Mondelēz International | S&P 500 | Performance Peer Group | |||||||||||||||||
| 2019 | $ | 100.00 | $ | 100.00 | $ | 100.00 | ||||||||||||||
| 2020 | 108.58 | 118.40 | 109.42 | |||||||||||||||||
| 2021 | 125.82 | 152.39 | 125.09 | |||||||||||||||||
| 2022 | 129.50 | 124.79 | 123.92 | |||||||||||||||||
| 2023 | 143.96 | 157.59 | 121.46 | |||||||||||||||||
| 2024 | 121.94 | 197.02 | 123.32 | |||||||||||||||||
The Mondelēz International performance peer group consists of the following companies considered our market competitors or that have been selected on the basis of industry, global focus or industry leadership: Campbell Soup Company, The Coca-Cola Company, Colgate-Palmolive Company, Danone S.A., General Mills, Inc., The Hershey Company, Kellanova, The Kraft Heinz Company, Nestlé S.A., PepsiCo, Inc., The Procter & Gamble Company and Unilever PLC.
30 | | |||||||
Issuer Purchases of Equity Securities
Our stock repurchase activity for each of the three months in the quarter ended December 31, 2024 was:
| Period | Total Number of Shares Purchased (1) | Average Price Paid per Share (1) | Total Number of Shares Purchased as Part of Publicly Announced Plans or Programs (2) (3) | Approximate Dollar Value of Shares That May Yet Be Purchased Under the Plans or Programs (2) | ||||||||||||||||||||||
| October 1-31, 2024 | 3,497 | $ | 79.25 | — | $ | 3,266 | ||||||||||||||||||||
| November 1-30, 2024 | 3,587,410 | 64.43 | 3,585,592 | 3,035 | ||||||||||||||||||||||
| December 1-31, 2024 | 15,935,293 | 60.96 | 15,935,259 | 2,064 | ||||||||||||||||||||||
For the Quarter Ended December 31, 2024 | 19,526,200 | $ | 61.60 | 19,520,851 | ||||||||||||||||||||||
(1)The total number of shares purchased (and the average price paid per share) reflects: (i) shares purchased pursuant to the repurchase program described in (2) below; and (ii) shares tendered to us by employees who used shares to exercise options and to pay the related taxes for grants of deferred stock units that vested, totaling 3,497 shares, 1,818 shares and 34 shares for the fiscal months of October, November and December 2024, respectively.
(2)Dollar values stated in millions. Effective January 1, 2023, our Board of Directors authorized a program for the repurchase of up to $6.0 billion of our Common Stock through December 31, 2025, excluding excise tax. During the year ended December 31, 2023, we repurchased approximately $1.6 billion of Common Stock pursuant to this authorization. During the year ended December 31, 2024, we repurchased $2.4 billion. On December 10, 2024, our Board of Directors authorized a new program for the repurchase of up to $9.0 billion of our Common Stock through December 31, 2027, excluding excise tax. This authorization, effective January 1, 2025, replaced our prior share repurchase program. See related information in Note 13, Capital Stock.
(3)As of January 1, 2023, our share repurchases in excess of issuances are subject to a 1% excise tax enacted by the Inflation Reduction Act. Any excise tax incurred on share repurchases is recognized as part of the cost basis of the shares acquired in the consolidated statements of equity.
Item 6. Reserved.
31 | | |||||||
Item 7. Management’s Discussion and Analysis of Financial Condition and Results of Operations.
The following discussion and analysis contains forward-looking statements. It should be read in conjunction with the other sections of this Annual Report on Form 10-K, including the consolidated financial statements and related notes contained in Forward-Looking Statements and Item 1A, Risk Factors.
Overview of Business and Strategy
Our core business is making and selling chocolate, biscuits and baked snacks, with additional businesses in adjacent, locally relevant categories including gum & candy, cheese & grocery and powdered beverages around the world.
We aim to be the global leader in snacking. Our strategy is to drive long-term growth by focusing on four strategic priorities: accelerating consumer-centric growth, driving operational excellence, creating a winning growth culture and scaling sustainable snacking. We believe the successful implementation of our strategic priorities and leveraging of our attractive global footprint, strong core of iconic global and local brands, marketing, sales, distribution and cost excellence capabilities, and top talent with a growth mindset, will drive consistent top- and bottom-line growth, enabling us to continue to create long-term value for our shareholders.
For more detailed information on our business and strategy, refer to Item 1, Business.
Recent Developments and Significant Items Affecting Comparability
Macroeconomic environment
We continue to observe significant market and geopolitical uncertainty, fluctuating consumer demand, inflationary pressures, supply constraints, trade and regulatory uncertainty and exchange rate volatility. As a result, we experienced significantly higher operating costs, including higher overall raw material, labor and energy costs that have continued to rise. In particular, we expect to continue to face higher cocoa costs, as the market price for cocoa beans has increased significantly year-over-year and it is likely that prices will remain elevated for some time. Refer to Commodity Trends for additional information.
Our overall outlook for future snacks revenue growth remains strong; however, we anticipate ongoing volatility. We will continue to proactively manage our business in response to the evolving global economic environment, related uncertainty and business risks while also prioritizing and supporting our employees and customers. We continue to take steps to mitigate impacts to our supply chain, operations, technology and assets.
Additionally, we provide more information on risks related to trade and regulatory uncertainty in our Financial Outlook section and under Item 1A, Risk Factors.
War in Ukraine
In February 2022, following the Russian military invasion of Ukraine, we stopped production and closed our facilities in Ukraine; since then we have taken steps to protect the safety of our employees and to restore operations at our two manufacturing facilities, which were significantly damaged in March 2022. See Note 1, Summary of Significant Accounting Policies - War in Ukraine, to the consolidated financial statements, and refer to Items Affecting Comparability of Financial Results for additional information.
We have suspended new capital investments and our advertising spending in Russia, but as a food company with more than 2,500 employees in the country, we have not ceased operations given we believe we play a role in the continuity of the food supply. We continue to evaluate the situation in Ukraine and Russia and our ability to control our operating activities and businesses on an ongoing basis and comply with applicable international sanctions. We continue to consolidate both our Ukrainian and Russian subsidiaries. During both 2024 and 2023, Ukraine generated 0.4% and Russia generated 2.9% of consolidated net revenue. The profitability of and the assets held by our Russian business continue to remain above historic levels. We cannot predict if the recent strength in our Russian business will continue in the future.
Our operations in Russia are subject to risks, including the temporary or permanent loss of assets due to expropriation or further curtailment of our ability to conduct business operations in Russia. In the event this were to
32 | | |||||||
occur, this could lead to the partial or full impairment of our Russian assets or deconsolidation of the operations in Russia in future periods, or the termination of and loss of revenue from our business operations, based on actions taken by Russia, other parties or us. For additional information, see Item 1A, Risk Factors, including the risk entitled “The war in Ukraine has impacted and could continue to impact our business operations, financial performance and results of operations.”
Developments in the Middle East
In October 2023, conflict developed in the Middle East between Hamas and Israel, and has expanded to other parts of the region. During 2024, we experienced sales impacts related to this conflict in certain AMEA markets, but this did not have a material impact on our business, results of operations or financial condition. We continue to evaluate the impacts of these developments on our business and we cannot predict if it will have a significant impact in the future.
ERP System Implementation
In July 2024, our Board of Directors approved funding of $1.2 billion for a multi-year systems transformation program to upgrade our global ERP and supply chain systems (the “ERP System Implementation”). The ERP System Implementation spending comprises both capital expenditures and operating expenses, of which a majority is expected to relate to operating expenses. The operating expenses associated with the ERP System Implementation represent incremental transformational costs above the normal ongoing level of spending on information technology to support operations. The ERP System Implementation program will be implemented by region in several phases with spending occurring over the next five years, with expected completion by year-end 2028. Refer to Non-GAAP financial measures and Note 1, Summary of Significant Accounting Policies for additional information.
Extreme Price Growth in Argentina
During December 2023, the Argentinean peso significantly devalued. The peso's devaluation and potential resulting distortion on our non-GAAP Organic Net Revenue, Organic Net Revenue growth and other constant currency growth rate measures resulted in our decision to exclude the impact of pricing increases in excess of 26% year-over-year ("extreme pricing") in Argentina, from these measures beginning in Q1 2024. The benchmark of 26% represents the minimum annual inflation rate for each year over a 3-year period which would result in a cumulative inflation rate in excess of 100%, the level at which an economy is considered hyperinflationary under U.S. GAAP. Throughout the following MD&A discussion, we now exclude, on a prospective basis beginning on January 1, 2024, the impact of extreme pricing in Argentina from the net pricing impact of Organic Net Revenue and Organic Net Revenue growth and its related impact on our other non-GAAP financial constant currency growth measures with a corresponding offset to changes in currency translation rates. Additionally within the MD&A discussion, "currency-related items" totals the impact of extreme pricing and the currency translation rate changes. Refer to Non-GAAP financial measures for additional information.
Currency-related items impacted our non-GAAP financial measures for the year ended December 31, 2024 as follows:
•Organic Net Revenue: In total, unfavorable currency-related items of $710 million (2.0 pp) were driven by unfavorable currency translation rate changes of $1,877 million (5.2 pp), partially offset by extreme pricing of $1,167 million (3.2 pp). In Emerging Markets, unfavorable currency-related items of $778 million (5.6 pp) were driven by unfavorable currency translation rate changes of $1,945 million (13.9 pp), partially offset by extreme pricing of $1,167 million (8.3 pp). In Developed Markets, favorable currency-related items of $68 million (0.3 pp) were driven by favorable currency translation rate changes.
•Adjusted Operating Income: Unfavorable currency-related items of $191 million were driven by unfavorable currency translation rate changes of $460 million, partially offset by extreme pricing of $269 million.
•Adjusted EPS: Unfavorable currency-related items of $0.12 were driven by unfavorable currency translation rate changes of $0.32, partially offset by extreme pricing of $0.20.
33 | | |||||||
Acquisitions and Divestitures
During 2024, we completed the acquisition of Evirth (Shanghai) Industrial Co., Ltd. (“Evirth”), a leading manufacturer of cakes and pastries in China.
During 2022, we completed the following acquisitions to strategically complement and expand our existing portfolio:
•Ricolino, a confectionery business with products sold primarily in Mexico
•Clif Bar & Company (“Clif Bar”), a leading U.S. maker of nutritious energy bars with organic ingredients
•Chipita Global S.A. ("Chipita"), a high-growth leader in the central and Eastern European croissant and baked snacks category
Additionally in the fourth quarter of 2022, we announced an agreement to sell the developed market gum business. On October 1, 2023, we completed the sale of our developed market gum business to Perfetti Van Melle Group, excluding the Portugal business which we retained pending regulatory approval. After obtaining the regulatory approval, we completed the sale of the Portugal business to Perfetti Van Melle Group on October 23, 2023.
Refer to Note 2, Acquisitions and Divestitures, and Liquidity and Capital Resources for additional details.
Investment Transactions
JDE Peet’s Transactions (Euronext Amsterdam: “JDEP”)
During the first quarter of 2024, we determined there was an other-than-temporary impairment of our investment in JDEP, resulting in an impairment charge of €612 million ($665 million). On November 29, 2024, we sold our remaining 85.9 million shares to JAB Holdings Company and recorded a gain of €313 million ($332 million)
In 2023, we sold approximately 9.9 million of our shares, which reduced our ownership interest by 2.0 percentage points, from 19.7% to 17.7%. We recorded a loss of €21 million ($23 million). In 2022, we sold approximately 18.6 million of our shares back to JDEP, which reduced our ownership interest by approximately 3.0 percentage points. We recorded a loss of €8 million ($8 million).
Keurig Dr Pepper Transactions (Nasdaq: "KDP")
In 2023, we sold the remainder of our shares in KDP, representing approximately 76 million shares. Our reduction in ownership to below 5% eliminated our significant influence over KDP, resulting in a change in accounting from equity method investment accounting to accounting for equity interests with readily determinable fair values in the first quarter of 2023. Prior to this change, we recorded a pre-tax gain on equity method transactions of $493 million ($368 million after-tax) in 2023. After the change in accounting, we recorded pre-tax gains for marketable securities of $606 million in 2023.
For additional information, refer to Note 7, Investments and Note 10, Financial Instruments.
Benefit Plans
During the third quarter of 2024, we entered into an agreement with two third party insurance companies for the Mondelēz Global LLC Retirement Plan (“MDLZ Global Plan”), the pension plan for US salaried employees. The agreement features a buy-in of the plan assets with an option to elect a future buy-out conversion. The MDLZ Global Plan was terminated on December 31, 2024, and we intend to execute the buy-out conversion in 2025. Refer to Note 10, Benefit Plans for additional information.
Taxes
We continue to monitor existing and potential future tax reform around the world. Numerous countries have now enacted the Organization of Economic Cooperation and Development’s model rules on a global minimum tax, effective for 2024. Important details of these minimum tax regimes are still being considered. Based on the guidance available thus far, this legislation did not have a material impact on our consolidated financial statements, but we will continue to evaluate it as additional guidance and clarification becomes available.
34 | | |||||||
Financial Outlook
We seek to achieve profitable, long-term growth and manage our business to attain this goal using our key operating metrics: Organic Net Revenue, Adjusted Operating Income and Adjusted EPS. We use these non-GAAP financial metrics and related computations, particularly growth in profit dollars, to evaluate and manage our business and to plan and make near- and long-term operating and strategic decisions. As such, we believe these metrics are useful to investors as they provide supplemental information in addition to our U.S. Generally Accepted Accounting Principles (“U.S. GAAP”) financial results. We believe it is useful to provide investors with the same financial information that we use internally to make comparisons of our historical operating results, identify trends in our underlying operating results and evaluate our business. We believe our non-GAAP financial measures should always be considered in relation to our GAAP results. Refer to Non-GAAP Financial Measures for the definitions of our non-GAAP financial measures and Consolidated Results of Operations for the respective reconciliations.
In addition to monitoring our key operating metrics, we monitor a number of developments and trends that could impact our revenue and profitability objectives:
Demand
We monitor consumer spending and our market share within the food and beverage categories in which we sell our products. Core snacks categories continued to expand due to the continued growth of snacking as a consumer behavior around the world. As part of our strategic plan, we seek to drive category growth by leveraging our local and consumer-focused commercial approach, making investments in our brand and snacks portfolio, building strong routes to market in both emerging and developed markets and improving our availability across multiple channels. We believe these actions will help drive demand in our categories and strengthen our positions across markets.
Long-Term Demographics and Consumer Trends
Snack food consumption is highly correlated to GDP growth, urbanization of populations and rising discretionary income levels associated with a growing middle class, particularly in emerging markets. We believe that snacks continue to be a source of comfort as well as excitement and variety for consumers. Social media increasingly helps consumers find food trends, inspiration and connection on their social media and other feeds. Consumers are also interested in buying snacks conveniently, whether through same-day delivery platforms, shipped sources or different retail settings. Many consumers also continue to prioritize sustainability in their purchase decisions, valuing sustainably sourced ingredients, low carbon footprint preparation and lower waste packaging. We seek to continue to offer snacks that meet consumer needs and preferences and align with our strategic priorities.
Pricing
Our net revenue growth and profitability may be affected as we adjust prices to address new conditions, such as increasing input and operating costs due to supply, transportation and labor constraints, the impact of tariffs and higher cost trends. We adjust our product prices based on a number of variables including market factors, transportation, logistics and changes in our product input costs, and we have increased prices to control costs given significant cost inflation.
Operating Costs
Our operating costs include raw materials, labor, selling, general and administrative expenses, taxes, currency impacts and financing costs. We manage these costs through cost saving and productivity initiatives, sourcing and hedging programs, pricing actions, refinancing and tax planning. We experienced significantly higher operating costs, including higher overall raw material (particularly cocoa) and labor costs that have continued to rise. Refer to Commodity Trends for additional information.
Trade and Regulatory Uncertainty
In many markets, including the United States, a portion of our products, including significant inputs, are imported from other jurisdictions. On February 1, 2025, the United States government announced tariffs up to 25% on imports from certain countries, including Mexico and Canada, and 10% tariffs on product imports from certain countries, including China. While we are still evaluating the potential impact of these actions as well as our ability to mitigate the impact, they are expected to adversely impact our revenue and cost of goods sold in the United States. If the provisions of those tariffs were maintained as proposed, we would expect those adverse impacts to be significant. In addition, retaliatory tariffs imposed by other countries or other potential government actions, would likely result in further adverse impacts to our revenue and cost of goods sold. For additional information, see Item 1A, Risk Factors, including the risk entitled “We are subject to risks from changes to the trade policies and tariff and import/export regulations by the U.S. and/or other foreign governments.”
35 | | |||||||
Summary of Results
•Net revenues were approximately $36.4 billion in 2024 and $36.0 billion in 2023, an increase of 1.2% in 2024 and an increase of 14.4% in 2023.
–Net revenues increased in 2024, driven by higher net pricing and incremental net revenue from our acquisition of Evirth, partially offset by unfavorable currency-related items, as the U.S. dollar strengthened relative to most currencies we operate in compared to exchange rates in the prior year, the impact of our 2023 divestiture of the developed market gum business and unfavorable volume/mix.
–Net revenues increased in 2023, driven by higher net pricing, incremental net revenues from our acquisitions of Clif Bar and Ricolino in 2022, favorable volume/mix and incremental net revenue from a short-term distributor agreement related to the sale of our developed market gum business, partially offset by a significant impact from unfavorable currency translation, as the U.S. dollar strengthened relative to most currencies we operate in compared to exchange rates in the prior year, and the impact of our developed market gum divestiture in 2023.
•Organic Net Revenue, a non-GAAP financial measure, increased 4.3% to $37.1 billion in 2024 and increased 14.7% to $35.6 billion in 2023. In 2024, Organic Net Revenue increased due to higher net pricing, partially offset by unfavorable volume/mix. In 2023, Organic Net Revenue grew due to higher net pricing and favorable volume/mix. Organic Net Revenue is on a constant currency basis and excludes revenue from acquisitions and divestitures. Refer to Non-GAAP Financial Measures for the definition of Organic Net Revenue and Consolidated Results of Operations for our reconciliation with net revenues.
•Diluted EPS attributable to Mondelēz International decreased 5.5% to $3.42 in 2024 and increased 84.7% to $3.62 in 2023.
–Diluted EPS decreased in 2024 driven by lapping prior-year gain on marketable securities, lapping prior-year gain on equity method investment transactions, 2024 net loss on equity method transactions including an impairment, lapping prior-year gain and operating results from the developed market gum business divested in 2023, higher intangible asset impairment charges and costs incurred for the ERP Systems Implementation program. These unfavorable items were partially offset by an increase in Adjusted EPS, favorable year-over-year change in acquisition integration costs and contingent consideration adjustments, favorable year-over-year change in mark-to-market impacts from commodity and currency derivatives, lower divestiture-related costs, lower remeasurement loss of net monetary position, favorable year-over-year change in initial impacts from enacted tax law changes and lapping prior-year impact from the European Commission legal matter.
–Diluted EPS increased in 2023 driven by an increase in Adjusted EPS, a gain on marketable securities, favorable year-over-year change in mark-to-market impacts from currency and commodity derivatives, higher net gain on equity method investment transactions, lower impact from the European Commission legal matter, lapping prior year acquisition-related costs, lapping prior year incremental costs due to the war in Ukraine, a gain on divestiture, lapping prior year loss on debt extinguishment, lower intangible asset impairment charges and lapping prior year inventory step-up charges. These favorable items were partially offset by lower operating results from divestitures, higher acquisition integration costs and contingent consideration adjustments, higher negative initial impacts from enacted tax law changes, higher remeasurement loss of net monetary position, higher divestiture-related costs, lapping prior year 2017 malware incident net recoveries and higher Simplify to Grow program costs.
•Adjusted EPS, a non-GAAP financial measure, increased 9.1% to $3.36 in 2024 and increased 15.4% to $3.08 in 2023. On a constant currency basis, Adjusted EPS increased 13.0% to $3.48 in 2024 and increased 20.2% to $3.21 in 2023. Refer to Non-GAAP Financial Measures for the definition of Adjusted EPS and Consolidated Results of Operations for our reconciliation with diluted EPS.
–Adjusted EPS increased in 2024, driven by operating gains, fewer shares outstanding, lower taxes, lower interest expense, impact from an acquisition and higher benefit plan non-service income, partially offset by unfavorable currency-related items and lapping prior year dividend income related to our former KDP investment.
–Adjusted EPS increased in 2023, driven by operating gains, impact from acquisitions, lower interest expense, fewer shares outstanding, dividend income from marketable securities and higher equity method investment earnings, partially offset by unfavorable currency translation, higher taxes and lower benefit plan non-service income.
36 | | |||||||
Discussion and Analysis of Historical Results
Items Affecting Comparability of Financial Results
The following table includes significant income or (expense) items that affected the comparability of our results of operations and our effective tax rates. Please refer to the notes to the consolidated financial statements indicated below for more information. Refer also to the Consolidated Results of Operations – Net Earnings and Earnings per Share Attributable to Mondelēz International table for the after-tax per share impacts of these items.
| For the Years Ended December 31, | |||||||||||||||||||||||
| See Note | 2024 | 2023 | 2022 | ||||||||||||||||||||
| (in millions, except percentages) | |||||||||||||||||||||||
| Simplify to Grow Program | Note 8 | ||||||||||||||||||||||
| Restructuring Charges | $ | (77) | $ | (106) | $ | (36) | |||||||||||||||||
| Implementation Charges | (72) | (25) | (87) | ||||||||||||||||||||
| Intangible asset impairment charges | Note 6 | (153) | (26) | (101) | |||||||||||||||||||
Mark-to-market gains/(losses) from derivatives (1) | Note 10 | 544 | 185 | (318) | |||||||||||||||||||
| Acquisition and divestiture-related costs | Note 2 | ||||||||||||||||||||||
Acquisition integration costs and contingent consideration adjustments (1) | 315 | (246) | (148) | ||||||||||||||||||||
| Inventory step-up | (3) | — | (25) | ||||||||||||||||||||
| Acquisition-related costs | (3) | — | (254) | ||||||||||||||||||||
Gain on acquisition and divestitures | 4 | 108 | — | ||||||||||||||||||||
| Divestiture-related costs | (1) | (83) | (18) | ||||||||||||||||||||
| 2017 Malware incident net recoveries | — | — | 37 | ||||||||||||||||||||
Incremental costs due to war in Ukraine | Note 1 | (3) | 1 | (121) | |||||||||||||||||||
| European Commission legal matter | Note 14 | 3 | (43) | (318) | |||||||||||||||||||
ERP System Implementation costs (2) | (78) | — | — | ||||||||||||||||||||
| Remeasurement of net monetary position | Note 1 | (31) | (98) | (40) | |||||||||||||||||||
Impact from pension participation changes (1) | Note 11 | (10) | (10) | (10) | |||||||||||||||||||
| Loss on debt extinguishment and related expenses | Note 9 | — | (1) | (129) | |||||||||||||||||||
| Initial impacts from enacted tax law changes | Note 16 | (24) | (83) | (17) | |||||||||||||||||||
Gain on marketable securities | Note 7 | — | 593 | — | |||||||||||||||||||
(Loss)/gain on equity method investment transactions (3) | Note 7 | (321) | 462 | (22) | |||||||||||||||||||
| Effective tax rate | Note 16 | 23.5 | % | 26.1 | % | 26.8 | % | ||||||||||||||||
(1)Includes impacts recorded in operating income, benefit plan non-service income and interest expense and other, net. Mark-to-market gains/(losses) above also include our equity method investment-related derivative contract mark-to-market gains/(losses) (refer to Note 10, Financial Instruments) that are recorded in the gain on equity method investment transactions on our consolidated statement of earnings.
(2)ERP System Implementation program costs represent incremental operating expenses above the normal ongoing level of spending on information technology to support operations. These expenses include third-party consulting fees, direct labor costs associated with the program, accelerated depreciation of our existing SAP financial systems and various other expenses, all associated with the implementation of our information technology upgrades.
(3)(Loss)/gain on equity method investment transactions includes impairments and is recorded outside pre-tax operating results on the consolidated statement of earnings. See footnote (1) as mark-to-market gains/(losses) on our equity method-investment-related derivative contracts are presented in the table above within mark-to-market gains/(losses) from derivatives. In addition, the amount shown in 2024 is inclusive of the gain on economic hedges related to sales proceeds from our JDEP transaction, which was recorded in Interest and other expense, net.
37 | | |||||||
Consolidated Results of Operations
The following discussion compares our consolidated results of operations for 2024 with 2023 and 2023 with 2022.
2024 compared with 2023
| For the Years Ended December 31, | |||||||||||||||||||||||
| 2024 | 2023 | $ Change | % Change | ||||||||||||||||||||
| (in millions, except per share data) | |||||||||||||||||||||||
| Net revenues | $ | 36,441 | $ | 36,016 | $ | 425 | 1.2 | % | |||||||||||||||
| Operating income | 6,345 | 5,502 | 843 | 15.3 | % | ||||||||||||||||||
Net earnings attributable to Mondelēz International | 4,611 | 4,959 | (348) | (7.0) | % | ||||||||||||||||||
Diluted earnings per share attributable to Mondelēz International | 3.42 | 3.62 | (0.20) | (5.5) | % | ||||||||||||||||||
Net Revenues
Net revenues increased $425 million (1.2%) to $36,441 million in 2024, and Organic Net Revenue (1) increased $1,544 million (4.3%) to $37,054 million. Emerging markets net revenues increased 1.1% and emerging markets Organic Net Revenue increased 6.2% (1). Developed markets net revenues increased 1.2% and developed markets Organic Net Revenue increased 3.2% (1). The underlying changes in net revenues and Organic Net Revenue are detailed below:
| Emerging Markets | Developed Markets | Mondelēz International | |||||||||||||||
| For The Year Ended December 31, 2024 | |||||||||||||||||
| Reported (GAAP) | $ | 14,163 | $ | 22,278 | $ | 36,441 | |||||||||||
Short-term distributor agreements | (3) | (22) | (25) | ||||||||||||||
| Acquisitions | (72) | — | (72) | ||||||||||||||
Currency-related items | 778 | (68) | 710 | ||||||||||||||
| Organic (Non-GAAP) | $ | 14,866 | $ | 22,188 | $ | 37,054 | |||||||||||
| For The Year Ended December 31, 2023 | |||||||||||||||||
| Reported (GAAP) | $ | 14,011 | $ | 22,005 | $ | 36,016 | |||||||||||
| Divestitures | (5) | (479) | (484) | ||||||||||||||
| Short-term distributor agreements | (2) | (20) | (22) | ||||||||||||||
| Organic (Non-GAAP) | $ | 14,004 | $ | 21,506 | $ | 35,510 | |||||||||||
$ Change | |||||||||||||||||
Reported (GAAP) | 1.1 | % | 1.2 | % | 1.2 | % | |||||||||||
| Divestitures | - pp | 2.3 pp | 1.4 pp | ||||||||||||||
| Acquisitions | (0.5) | — | (0.3) | ||||||||||||||
Currency-related items | 5.6 | (0.3) | 2.0 | ||||||||||||||
Organic (Non-GAAP) | 6.2 | % | 3.2 | % | 4.3 | % | |||||||||||
| Vol/Mix | (0.6)pp | (1.1)pp | (1.0)pp | ||||||||||||||
| Pricing | 6.8 | 4.3 | 5.3 | ||||||||||||||
(1)Please see the Non-GAAP Financial Measures section for additional information.
Net revenue increase of 1.2% was driven by our underlying Organic Net Revenue growth of 4.3% and the impact of an acquisition, partially offset by unfavorable currency-related items and the impact of our 2023 divestiture of the developed market gum business. Organic Net Revenue growth was driven by higher net pricing, partially offset by unfavorable volume/mix. Higher net pricing in all regions was due to the benefit of carryover pricing from 2023 as well as the effects of input cost-driven pricing actions taken during 2024. Overall, unfavorable volume/mix was driven by volume declines, reflecting the impacts of expected customer price negotiation disruptions in Europe primarily in the second quarter, consumer demand softness in the U.S. and Mexico in the first half of the year and geopolitical impacts in parts of AMEA, which were partially offset by favorable product mix. Unfavorable volume/mix was reflected in Europe and Latin America, partially offset by a gain in AMEA, while North America was essentially flat. The November 1, 2024 acquisition of Evirth added incremental net revenues of $72 million (constant currency basis) in 2024. Currency-related items decreased net revenues by $710 million, driven by unfavorable currency
38 | | |||||||
translation rate changes, partially offset by the adjustment for extreme pricing in Argentina. Refer to Recent Developments and Significant Items Affecting Comparability for additional information. Unfavorable currency translation rate changes were due to the strength of the U.S. dollar relative to most currencies, primarily the Argentinean peso, as well as the Brazilian real, Nigerian naira, Turkish Lira, Russian ruble, Egyptian pound, Mexican peso and Chinese yuan, partially offset by the strength of a few currencies relative to the U.S. dollar, including the British pound sterling, Polish zloty, euro and Colombian peso. The impact of our 2023 divestiture of the developed market gum business resulted in a year-over-year reduction in net revenues of $484 million in 2024. Refer to Note 2, Acquisitions and Divestitures, for additional information.
Operating Income
Operating income increased $843 million (15.3%) to $6,345 million in 2024, Adjusted Operating Income (1) increased $265 million (4.7%) to $5,899 million and Adjusted Operating Income on a constant currency basis increased $456 million (8.1%) to $6,090 million due to the following:
| For the Years Ended December 31, | |||||||||||||||||||||||
| 2024 | 2023 | $ Change | % Change | ||||||||||||||||||||
| (in millions) | |||||||||||||||||||||||
| Operating Income | $ | 6,345 | $ | 5,502 | $ | 843 | 15.3 | % | |||||||||||||||
Simplify to Grow Program (2) | 149 | 131 | 18 | ||||||||||||||||||||
Intangible asset impairment charges (3) | 153 | 26 | 127 | ||||||||||||||||||||
Mark-to-market gains from derivatives (4) | (543) | (189) | (354) | ||||||||||||||||||||
Acquisition integration costs and contingent consideration adjustments (5) | (315) | 246 | (561) | ||||||||||||||||||||
Inventory step-up (5) | 3 | — | 3 | ||||||||||||||||||||
Acquisition-related costs (5) | 3 | — | 3 | ||||||||||||||||||||
Gain on acquisition and divestitures (5) | (4) | (108) | 104 | ||||||||||||||||||||
Divestiture-related costs (5) | 1 | 83 | (82) | ||||||||||||||||||||
Operating results from divestitures (5) | — | (194) | 194 | ||||||||||||||||||||
Operating results from short-term distributor agreements | (2) | (3) | 1 | ||||||||||||||||||||
European Commission legal matter (6) | (3) | 43 | (46) | ||||||||||||||||||||
Incremental costs due to war in Ukraine (7) | 3 | (1) | 4 | ||||||||||||||||||||
ERP System Implementation costs (8) | 78 | — | 78 | ||||||||||||||||||||
Remeasurement of net monetary position (9) | 31 | 98 | (67) | ||||||||||||||||||||
Adjusted Operating Income (1) | $ | 5,899 | $ | 5,634 | $ | 265 | 4.7 | % | |||||||||||||||
Currency-related items | 191 | — | 191 | ||||||||||||||||||||
Adjusted Operating Income (constant currency) (1) | $ | 6,090 | $ | 5,634 | $ | 456 | 8.1 | % | |||||||||||||||
| Key Drivers of Adjusted Operating Income (constant currency) | $ Change | ||||||||||||||||||||||
| Higher net pricing | $ | 1,889 | |||||||||||||||||||||
| Higher input costs | (1,079) | ||||||||||||||||||||||
| Unfavorable volume/mix | (149) | ||||||||||||||||||||||
| Higher selling, general and administrative expenses | (215) | ||||||||||||||||||||||
Impact from acquisitions (5) | 10 | ||||||||||||||||||||||
| Higher amortization of intangible assets | (1) | ||||||||||||||||||||||
| Lower asset impairment charges | 1 | ||||||||||||||||||||||
Total change in Adjusted Operating Income (constant currency) (1) | $ | 456 | |||||||||||||||||||||
(1)Refer to the Non-GAAP Financial Measures section for additional information.
(2)Refer to Note 8, Restructuring Program, for more information.
(3)Refer to Note 6, Goodwill and Intangible Assets, for more information.
(4)Refer to Note 10, Financial Instruments, and the Non-GAAP Financial Measures section for more information on the unrealized gains/losses on commodity and forecasted currency transaction derivatives.
39 | | |||||||
(5)Refer to Note 2, Acquisitions and Divestitures, for more information on the November 1, 2024 acquisition of Evirth, October 1, 2023 sale of the developed market gum business, November 1, 2022 acquisition of Ricolino, August 1, 2022 acquisition of Clif Bar and the January 3, 2022 acquisition of Chipita.
(6)Refer to Note 14, Commitments and Contingencies, for more information.
(7)Refer to Note 1, Summary of Significant Accounting Policies – War in Ukraine, for more information.
(8)Refer to Recent Developments and Significant Items Affecting Comparability - ERP System Implementation, for additional information.
(9)Refer to Note 1, Summary of Significant Accounting Policies – Currency Translation and Highly Inflationary Accounting, for information on our application of highly inflationary accounting for Argentina, Türkiye, Egypt and Nigeria.
During 2024, we realized higher net pricing, which was partially offset by increased input costs and unfavorable volume/mix. Higher net pricing, which included the carryover impact of pricing actions taken in 2023 as well as the effects of input cost-driven pricing actions taken during 2024, was reflected across all regions. The increase in input costs was driven by higher raw material costs, partially offset by lower manufacturing costs driven by productivity. Higher raw material costs were in part due to higher cocoa, sugar, nuts and other ingredient costs, as well as unfavorable year-over-year currency exchange transaction costs on imported materials, partially offset by lower energy, edible oils, grains, dairy and packaging costs. Overall, unfavorable volume/mix was due to volume declines partially offset by favorable product mix. Unfavorable volume/mix was experienced in all regions.
Total selling, general and administrative expenses decreased $563 million from 2023, which was net of benefits from a number of factors noted in the table above, including in part, favorable contingent consideration adjustments related to the Clif Bar acquisition and lower acquisition integration costs, lapping prior-year divestiture-related costs, the elimination of costs from the developed market gum business divested in 2023, lower remeasurement loss of net monetary position, a favorable currency translation impact related to expenses and lapping prior-year impact from the European Commission legal matter, marginally offset by costs incurred for the ERP System Implementation program and higher implementation costs incurred for the Simplify to Grow program. Excluding these factors, selling, general and administrative expenses increased $215 million from 2023. The increase was driven primarily by higher advertising and consumer promotion costs and higher overhead costs in part due to increased investments in route to market capabilities.
Unfavorable currency-related items, net of the adjustment for extreme pricing in Argentina, decreased operating income by $191 million primarily due to the strength of the U.S. dollar relative to most currencies, including the Argentinean peso, Russian ruble, Brazilian real, Egyptian pound, Turkish lira, Chinese yuan and Nigerian naira, partially offset by the strength of a few currencies relative to the U.S. dollar, primarily the British pound sterling and Polish zloty.
Operating income margin increased from 15.3% in 2023 to 17.4% in 2024. The increase in operating income margin was driven primarily by favorable year-over-year change in acquisition integration costs and contingent consideration adjustments, favorable year-over-year change in mark-to-market gains/(losses) from commodity and currency hedging activities, higher Adjusted Operating Income margin, lower divestiture-related costs, lapping prior-year impact from the European Commission legal matter and lower remeasurement loss of net monetary position, partially offset by higher intangible asset impairment charges, lapping the prior-year gain and the impact from the developed market gum business divested in 2023 and costs incurred for the ERP System Implementation program. Adjusted Operating Income margin increased from 15.9% in 2023 to 16.2% in 2024. The increase was driven primarily by higher net pricing, lower manufacturing costs driven by productivity and overhead cost leverage, partially offset by higher raw material costs and higher advertising and consumer promotion costs.
40 | | |||||||
Net Earnings and Earnings per Share Attributable to Mondelēz International
Net earnings attributable to Mondelēz International of $4,611 million decreased by $(348) million (7.0%) in 2024. Diluted EPS attributable to Mondelēz International was $3.42 in 2024, down $(0.20) (5.5%) from 2023. Adjusted EPS (1) was $3.36 in 2024, up $0.28 (9.1%) from 2023. Adjusted EPS on a constant currency basis was $3.48 in 2024, up $0.40 (13.0%) from 2023.
| For the Years Ended December 31, | |||||||||||||||||||||||
| 2024 | 2023 | $ Change | % Change | ||||||||||||||||||||
| Diluted EPS attributable to Mondelēz International | $ | 3.42 | $ | 3.62 | $ | (0.20) | (5.5) | % | |||||||||||||||
Simplify to Grow Program (2) | 0.09 | 0.08 | 0.01 | ||||||||||||||||||||
Intangible asset impairment charges (2) | 0.08 | 0.01 | 0.07 | ||||||||||||||||||||
Mark-to-market gains from derivatives (2) | (0.32) | (0.12) | (0.20) | ||||||||||||||||||||
Acquisition integration costs and contingent consideration adjustments (2) | (0.17) | 0.14 | (0.31) | ||||||||||||||||||||
Divestiture-related costs (2) | — | 0.04 | (0.04) | ||||||||||||||||||||
Operating results from divestitures (2) (3) | (0.07) | (0.17) | 0.10 | ||||||||||||||||||||
Gain on divestitures (2) | — | (0.08) | 0.08 | ||||||||||||||||||||
European Commission legal matter (2) | — | 0.01 | (0.01) | ||||||||||||||||||||
ERP System Implementation costs (2) | 0.04 | — | 0.04 | ||||||||||||||||||||
Remeasurement of net monetary position (2) | 0.02 | 0.07 | (0.05) | ||||||||||||||||||||
Impact from pension participation changes (2) | 0.01 | 0.01 | — | ||||||||||||||||||||
Initial impacts from enacted tax law changes (4) | 0.02 | 0.06 | (0.04) | ||||||||||||||||||||
Gain on marketable securities (5) | — | (0.34) | 0.34 | ||||||||||||||||||||
Loss/(gain) on equity method investment transactions (6) | 0.24 | (0.25) | 0.49 | ||||||||||||||||||||
Adjusted EPS (1) | $ | 3.36 | $ | 3.08 | $ | 0.28 | 9.1 | % | |||||||||||||||
Currency-related items | 0.12 | — | 0.12 | ||||||||||||||||||||
Adjusted EPS (constant currency) (1) | $ | 3.48 | $ | 3.08 | $ | 0.40 | 13.0 | % | |||||||||||||||
| Key Drivers of Adjusted EPS (constant currency) | $ Change | ||||||||||||||||||||||
| Increase in operations | $ | 0.24 | |||||||||||||||||||||
Impact from acquisitions (2) | 0.01 | ||||||||||||||||||||||
| Change in benefit plan non-service income | 0.01 | ||||||||||||||||||||||
Change in interest and other expense, net (6) | 0.04 | ||||||||||||||||||||||
Change in dividend income from marketable securities | (0.01) | ||||||||||||||||||||||
Change in income taxes (4) | 0.05 | ||||||||||||||||||||||
Change in shares outstanding (7) | 0.06 | ||||||||||||||||||||||
Total change in Adjusted EPS (constant currency) (1) | $ | 0.40 | |||||||||||||||||||||
(1)Refer to the Non-GAAP Financial Measures section appearing for additional information. The tax expense/(benefit) of each of the pre-tax items excluded from our GAAP results was computed based on the facts and tax assumptions associated with each item, and such impacts have also been excluded from Adjusted EPS.
•2024 taxes for the: Simplify to Grow Program were $(36) million, intangible asset impairment charges were $(40) million, mark-to-market gains from derivatives were $107 million, acquisition integration costs and contingent consideration adjustments were $89 million, operating results from divestitures were zero, ERP Systems Implementation costs were $(19) million, remeasurement of net monetary position were zero, impact from pension participation changes were $(3) million, initial impacts from enacted tax law changes were $24 million and loss on equity method investment transactions were $4 million.
•2023 taxes for the: Simplify to Grow Program were $(26) million, intangible asset impairment charges were $(6) million, mark-to-market gains from derivatives were $21 million, acquisition integration costs and contingent consideration adjustments were $(60) million, divestiture-related costs were $(25) million, operating results from divestitures were $46 million, gain on divestiture were $(8) million, European Commission legal matter were $(24) million, remeasurement of net monetary position were zero, impact from pension participation changes were $(3) million, initial impacts from enacted tax law changes were $83 million, gain on marketable securities were $133 million and gain on equity method investment transactions were $124 million.
(2)See the Operating Income table above and the related footnotes for more information.
41 | | |||||||
(3)Divestitures include completed sales of businesses, partial or full sales of equity method investments and exits of major product lines upon completion of a sale or licensing agreement.
(4)Refer to Note 16, Income Taxes, for information on income taxes.
(5)Refer to Note 7, Investments, for more information on gains on marketable securities and gains and losses on equity method investment transactions.
(6)Excludes the currency impact on interest expense related to our non-U.S. dollar-denominated debt which is included in currency translation.
(7)Refer to Note 12, Stock Plans, for more information on our equity compensation programs and share repurchase program and Note 17, Earnings per Share, for earnings per share weighted-average share information.
42 | | |||||||
2023 compared with 2022
| For the Years Ended December 31, | |||||||||||||||||||||||
| 2023 | 2022 | $ Change | % Change | ||||||||||||||||||||
| (in millions, except per share data) | |||||||||||||||||||||||
| Net revenues | $ | 36,016 | $ | 31,496 | $ | 4,520 | 14.4 | % | |||||||||||||||
| Operating income | 5,502 | 3,534 | 1,968 | 55.7 | % | ||||||||||||||||||
| Net earnings attributable to Mondelēz International | 4,959 | 2,717 | 2,242 | 82.5 | % | ||||||||||||||||||
| Diluted earnings per share attributable to Mondelēz International | 3.62 | 1.96 | 1.66 | 84.7 | % | ||||||||||||||||||
Net Revenues
Net revenues increased $4,520 million (14.4%) to $36,016 million in 2023, and Organic Net Revenue (1) increased $4,572 million (14.7%) to $35,570 million. Emerging markets net revenues increased 15.0% and emerging markets Organic Net Revenue increased 20.4% (1). Developed markets net revenues increased 13.9% and developed markets Organic Net Revenue increased 11.1%(1). The underlying changes in net revenues and Organic Net Revenue are detailed below:
| Emerging Markets | Developed Markets | Mondelēz International | |||||||||||||||
| For The Year Ended December 31, 2023 | |||||||||||||||||
| Reported (GAAP) | $ | 14,011 | $ | 22,005 | $ | 36,016 | |||||||||||
Divestitures | (5) | (479) | (484) | ||||||||||||||
| Short-term distributor agreements | (2) | (20) | (22) | ||||||||||||||
| Acquisitions | (507) | (529) | (1,036) | ||||||||||||||
| Currency | 1,138 | (42) | 1,096 | ||||||||||||||
| Organic (Non-GAAP) | $ | 14,635 | $ | 20,935 | $ | 35,570 | |||||||||||
| For The Year Ended December 31, 2022 | |||||||||||||||||
| Reported (GAAP) | $ | 12,184 | $ | 19,312 | $ | 31,496 | |||||||||||
| Divestitures | (27) | (471) | (498) | ||||||||||||||
| Organic (Non-GAAP) | $ | 12,157 | $ | 18,841 | $ | 30,998 | |||||||||||
% Change | |||||||||||||||||
Reported (GAAP) | 15.0 | % | 13.9 | % | 14.4 | % | |||||||||||
| Divestitures | 0.2 pp | 0.4 pp | 0.2 pp | ||||||||||||||
| Short-term distributor agreements | — | (0.2) | — | ||||||||||||||
| Acquisitions | (4.2) | (2.8) | (3.4) | ||||||||||||||
| Currency | 9.4 | (0.2) | 3.5 | ||||||||||||||
Organic (Non-GAAP) | 20.4 | % | 11.1 | % | 14.7 | % | |||||||||||
| Vol/Mix | 2.8 pp | 0.4 pp | 1.3 pp | ||||||||||||||
| Pricing | 17.6 | 10.7 | 13.4 | ||||||||||||||
(1)Please see the Non-GAAP Financial Measures section for additional information.
Net revenue increase of 14.4% was driven by our underlying Organic Net Revenue growth of 14.7%, the impact of acquisitions and the impact of a short-term distributor agreement, partially offset by unfavorable currency translation and the impact of divestitures. Overall, we continued to see strong demand for our snack category products across most regions. Organic Net Revenue growth was driven by higher net pricing and favorable volume/mix. Higher net pricing in all regions was due to the benefit of carryover pricing from 2022 as well as the effects of input cost-driven pricing actions taken during 2023. Favorable volume/mix was driven by AMEA, Latin America and Europe reflecting both improved product mix and volume gains, while volume/mix was essentially flat in North America. The November 1, 2022 acquisition of Ricolino added incremental net revenues of $507 million (constant currency basis) through the one-year anniversary of the acquisition. The August 1, 2022 acquisition of Clif Bar added incremental net revenues of $529 million through the one-year anniversary of the acquisition. The short-term distributor agreement related to the October 1, 2023 sale of our developed market gum business added incremental net revenues of $22 million. Unfavorable currency impacts decreased net revenues by $1,096 million, due primarily to the strength of the U.S. dollar relative to several currencies, primarily due to the Argentinean peso and Russian ruble as well as the Turkish lira, Egyptian pound, Indian rupee, Chinese yuan, Nigerian naira, Australian dollar,
43 | | |||||||
South African rand, Pakistan rupee and Canadian dollar, partially offset by the strength of several currencies relative to the U.S. dollar, including the Mexican peso, euro, Brazilian real, Polish zloty and British pound sterling. The impact of 2023 and 2022 divestitures resulted in a year-over-year reduction in net revenues of $14 million. Refer to Note 2, Acquisitions and Divestitures, for additional information.
Operating Income
Operating income increased $1,968 million (55.7%) to $5,502 million in 2023, Adjusted Operating Income (1) increased $749 million (15.3%) to $5,634 million and Adjusted Operating Income on a constant currency basis increased $939 million (19.2%) to $5,824 million due to the following:
| For the Years Ended December 31, | |||||||||||||||||||||||
| 2023 | 2022 | $ Change | % Change | ||||||||||||||||||||
| (in millions) | |||||||||||||||||||||||
| Operating Income | $ | 5,502 | $ | 3,534 | $ | 1,968 | 55.7 | % | |||||||||||||||
Simplify to Grow Program (2) | 131 | 122 | 9 | ||||||||||||||||||||
Intangible asset impairment charges (3) | 26 | 101 | (75) | ||||||||||||||||||||
Mark-to-market (gains)/losses from derivatives (4) | (189) | 326 | (515) | ||||||||||||||||||||
Acquisition integration costs (5) | 246 | 136 | 110 | ||||||||||||||||||||
Inventory step-up (5) | — | 25 | (25) | ||||||||||||||||||||
Acquisition-related costs (5) | — | 330 | (330) | ||||||||||||||||||||
Gain on divestitures (5) | (108) | — | (108) | ||||||||||||||||||||
Divestiture-related costs (5) | 83 | 18 | 65 | ||||||||||||||||||||
Operating results from divestitures (5) | (194) | (148) | (46) | ||||||||||||||||||||
Operating results from short-term distributor agreements | (3) | — | (3) | ||||||||||||||||||||
| 2017 Malware incident recoveries, net | — | (37) | 37 | ||||||||||||||||||||
European Commission legal matter (6) | 43 | 318 | (275) | ||||||||||||||||||||
Incremental costs due to war in Ukraine (7) | (1) | 121 | (122) | ||||||||||||||||||||
Remeasurement of net monetary position (8) | 98 | 40 | 58 | ||||||||||||||||||||
Impact from pension participation changes (9) | — | (1) | 1 | ||||||||||||||||||||
Adjusted Operating Income (1) | $ | 5,634 | $ | 4,885 | $ | 749 | 15.3 | % | |||||||||||||||
Currency-related items | 190 | — | 190 | ||||||||||||||||||||
Adjusted Operating Income (constant currency) (1) | $ | 5,824 | $ | 4,885 | $ | 939 | 19.2 | % | |||||||||||||||
| Key Drivers of Adjusted Operating Income (constant currency) | $ Change | ||||||||||||||||||||||
| Higher net pricing | $ | 4,143 | |||||||||||||||||||||
| Higher input costs | (2,522) | ||||||||||||||||||||||
| Favorable volume/mix | 189 | ||||||||||||||||||||||
| Higher selling, general and administrative expenses | (947) | ||||||||||||||||||||||
Impact from acquisitions (5) | 112 | ||||||||||||||||||||||
| Higher asset impairment charges | (36) | ||||||||||||||||||||||
Total change in Adjusted Operating Income (constant currency) (1) | $ | 939 | |||||||||||||||||||||
(1)Refer to the Non-GAAP Financial Measures section.
(2)Refer to Note 8, Restructuring Program, for more information.
(3)Refer to Note 6, Goodwill and Intangible Assets, for more information.
(4)Refer to Note 10, Financial Instruments, Note 18, Segment Reporting, and Non-GAAP Financial Measures for more information on the unrealized gains/losses on commodity and forecasted currency transaction derivatives.
(5)Refer to Note 2, Acquisitions and Divestitures, for more information on the October 1, 2023 sale of the developed market gum business, November 1, 2022 acquisition of Ricolino, August 1, 2022 acquisition of Clif Bar and the January 3, 2022 acquisition of Chipita.
(6)Refer to Note 14, Commitments and Contingencies, for more information.
(7)Refer to Note 1, Summary of Significant Accounting Policies – War in Ukraine, for more information.
(8)Refer to Note 1, Summary of Significant Accounting Policies – Currency Translation and Highly Inflationary Accounting, for information on our application of highly inflationary accounting for Argentina and Türkiye.
(9)Refer to Note 11, Benefit Plans, for more information.
44 | | |||||||
During 2023, we realized higher net pricing and favorable volume/mix, which was partially offset by increased input costs. Higher net pricing, which included the carryover impact of pricing actions taken in 2022 as well as the effects of input cost-driven pricing actions taken during 2023, was reflected across all regions. Overall, volume/mix benefited from improved product mix and continued strong demand for our snack category products across most regions. Favorable volume/mix was driven by AMEA, Latin America and Europe, which was marginally offset by slightly unfavorable volume/mix in North America. The increase in input costs was driven by higher raw material costs, slightly offset by lower manufacturing costs driven by productivity. Higher raw material costs were in part due to higher energy, sugar, grains, dairy, cocoa, packaging, edible oils and other ingredients costs as well as unfavorable year-over-year currency exchange transaction costs on imported materials.
Total selling, general and administrative expenses increased $618 million from 2022, due to a number of factors noted in the table above, including in part, the impact of acquisitions, higher acquisition integration costs and contingent consideration adjustments, higher divestiture-related costs, higher remeasurement loss of net monetary position and lapping prior-year 2017 malware incident net recoveries, which were offset by a lower impact from the European Commission legal matter, lapping prior year acquisition-related costs, a favorable currency impact related to expenses, lower implementation costs incurred for the Simplify to Grow program, the impact from divestitures and lower incremental costs due to the war in Ukraine. Excluding these factors, selling, general and administrative expenses increased $947 million from 2022. The increase was driven primarily by higher advertising and consumer promotion costs and higher overhead costs in part due to increased investments in route to market capabilities.
Unfavorable currency changes decreased operating income by $190 million, primarily due to the strength of the U.S. dollar relative to most currencies, including the Russian ruble, Argentinean peso, Egyptian pound, Chinese yuan, Indian rupee, Turkish lira, Australian dollar and South African rand, partially offset by the strength of a few currencies relative to the U.S. dollar, primarily the euro, Mexican peso, Brazilian real and Polish zloty.
Operating income margin decreased from 11.2% in 2022 to 15.3% in 2023. The decrease in operating income margin was driven primarily by the favorable year-over-year change in mark-to-market gains/(losses) from currency and commodity hedging activities, lapping prior year acquisition-related costs, lower impact from the European Commission legal matter, lower incremental costs due to the war in Ukraine, gain on the sale of our developed market gum business, lower intangible asset impairment charges, higher Adjusted Operating Income margin and lapping prior year inventory step-up charges, partially offset by higher acquisition integration costs and contingent consideration adjustments, higher divestiture-related costs, higher remeasurement loss of net monetary position and lapping prior year 2017 malware incident net recoveries. Adjusted Operating Income margin increased from 15.8% in 2022 to 15.9% in 2023. The increase was driven primarily by higher net pricing, overhead cost leverage, lower manufacturing costs driven by productivity and favorable product mix, partially offset by higher raw material costs and higher advertising and consumer promotion costs.
45 | | |||||||
Net Earnings and Earnings per Share Attributable to Mondelēz International
Net earnings attributable to Mondelēz International of $4,959 million increased by $2,242 million (82.5%) in 2023. Diluted EPS attributable to Mondelēz International was $3.62 in 2023, up $1.66 (84.7%) from 2022. Adjusted EPS (1) was $3.08 in 2023, up $0.41 (15.4%) from 2022. Adjusted EPS on a constant currency basis was $3.21 in 2023, up $0.54 (20.2%) from 2022.
| For the Years Ended December 31, | |||||||||||||||||||||||
| 2023 | 2022 | $ Change | % Change | ||||||||||||||||||||
| Diluted EPS attributable to Mondelēz International | $ | 3.62 | $ | 1.96 | $ | 1.66 | 84.7 | % | |||||||||||||||
Simplify to Grow Program (2) | 0.08 | 0.07 | 0.01 | ||||||||||||||||||||
Intangible asset impairment charges (2) | 0.01 | 0.05 | (0.04) | ||||||||||||||||||||
Mark-to-market (gains)/losses from derivatives (2) | (0.12) | 0.19 | (0.31) | ||||||||||||||||||||
Acquisition integration costs and contingent consideration adjustments (2) | 0.14 | 0.05 | 0.09 | ||||||||||||||||||||
Inventory step-up | — | 0.01 | (0.01) | ||||||||||||||||||||
Acquisition-related costs (2) | — | 0.19 | (0.19) | ||||||||||||||||||||
Divestiture-related costs (2) | 0.04 | 0.01 | 0.03 | ||||||||||||||||||||
Operating results from divestitures (2) | (0.17) | (0.30) | 0.13 | ||||||||||||||||||||
Gain on marketable securities (6) | (0.34) | — | (0.34) | ||||||||||||||||||||
2017 Malware incident net recoveries | — | (0.02) | 0.02 | ||||||||||||||||||||
European Commission legal matter | 0.01 | 0.23 | (0.22) | ||||||||||||||||||||
Incremental costs due to war in Ukraine | — | 0.09 | (0.09) | ||||||||||||||||||||
Gain on divestitures (2) | (0.08) | — | (0.08) | ||||||||||||||||||||
Remeasurement of net monetary position (2) | 0.07 | 0.03 | 0.04 | ||||||||||||||||||||
Impact from pension participation changes (2) | 0.01 | 0.01 | — | ||||||||||||||||||||
Loss on debt extinguishment (3) | — | 0.07 | (0.07) | ||||||||||||||||||||
Initial impacts from enacted tax law changes (4) | 0.06 | 0.01 | 0.05 | ||||||||||||||||||||
Gain on equity method investment transactions (5) | (0.25) | 0.02 | (0.27) | ||||||||||||||||||||
Adjusted EPS (1) | $ | 3.08 | $ | 2.67 | $ | 0.41 | 15.4 | % | |||||||||||||||
Currency-related items | 0.13 | — | 0.13 | ||||||||||||||||||||
Adjusted EPS (constant currency) (1) | $ | 3.21 | $ | 2.67 | $ | 0.54 | 20.2 | % | |||||||||||||||
| Key Drivers of Adjusted EPS (constant currency) | $ Change | ||||||||||||||||||||||
| Increase in operations | $ | 0.47 | |||||||||||||||||||||
Impact from acquisitions (2) | 0.06 | ||||||||||||||||||||||
| Change in benefit plan non-service income | (0.03) | ||||||||||||||||||||||
Change in interest and other expense, net (6) | 0.04 | ||||||||||||||||||||||
| Dividend income from marketable securities | 0.01 | ||||||||||||||||||||||
| Change in equity method investment net earnings | 0.01 | ||||||||||||||||||||||
Change in income taxes (4) | (0.05) | ||||||||||||||||||||||
Change in shares outstanding (7) | 0.03 | ||||||||||||||||||||||
Total change in Adjusted EPS (constant currency) (1) | $ | 0.54 | |||||||||||||||||||||
(1)The tax expense/(benefit) of each of the pre-tax items excluded from our GAAP results was computed based on the facts and tax assumptions associated with each item, and such impacts have also been excluded from Adjusted EPS.
•2023 taxes for the: Simplify to Grow Program were $(26) million, intangible asset impairment charges were $(6) million, mark-to-market gains from derivatives were $21 million, acquisition integration costs and contingent consideration adjustments were $(60) million, divestiture-related costs were $(25) million, operating results from divestitures were $46 million, gain on divestiture were $(8) million, European Commission legal matter were $(24) million, remeasurement of net monetary position were zero, impact from pension participation changes were $(3) million, initial impacts from enacted tax law changes were $83 million, gain on marketable securities were $133 million and gain on equity method investment transactions were $124 million.
46 | | |||||||
•2022 taxes for the: Simplify to Grow Program were $(26) million, intangible asset impairment charge were $(25) million, mark-to-market losses from derivatives were $(56) million, acquisition integration costs and contingent consideration adjustments were $(72) million, inventory step-up charges were $(7) million, acquisition-related costs were $11 million, divestiture-related costs were $(9) million operating results from divestitures were $50 million, 2017 malware incident net recoveries were $10 million, European Commission legal matter were zero, incremental costs due to the war in Ukraine were $4 million, remeasurement of net monetary position were zero, impact from pension participation changes were $(3) million, loss on debt extinguishment and related expenses were $(31) million, initial impacts from enacted tax law changes were $17 million and loss on equity method investment transactions were $2 million.
(2)See the Adjusted Operating Income table above and the related footnotes for more information.
(3)Refer to Note 9, Debt and Borrowing Arrangements, for more information on losses on debt extinguishment.
(4)Refer to Note 16, Income Taxes, for information on income taxes.
(5)Refer to Note 7, Investments, for more information on gains and losses on equity method investment transactions.
(6)Excludes the currency impact on interest expense related to our non-U.S. dollar-denominated debt which is included in currency translation.
(7)Refer to Note 12, Stock Plans, for more information on our equity compensation programs and share repurchase program and Note 17, Earnings per Share, for earnings per share weighted-average share information.
47 | | |||||||
Results of Operations by Operating Segment
Our operations and management structure are organized into four operating segments:
•Latin America
•AMEA
•Europe
•North America
We manage our operations by region to leverage regional operating scale, manage different and changing business environments more effectively and pursue growth opportunities as they arise across our key markets. Our regional management teams have responsibility for the business, product categories and financial results in the regions.
We use segment operating income to evaluate segment performance and allocate resources. We believe it is appropriate to disclose this measure to help investors analyze segment performance and trends. See Note 18, Segment Reporting, for additional information on our segments and Items Affecting Comparability of Financial Results earlier in this section for items affecting our segment operating results.
Our segment net revenues and operating earnings were:
| For the Years Ended December 31, | |||||||||||||||||
| 2024 | 2023 | 2022 | |||||||||||||||
| (in millions) | |||||||||||||||||
| Net revenues: | |||||||||||||||||
Latin America | $ | 4,926 | $ | 5,006 | $ | 3,629 | |||||||||||
AMEA | 7,296 | 7,075 | 6,767 | ||||||||||||||
Europe | 13,309 | 12,857 | 11,420 | ||||||||||||||
North America | 10,910 | 11,078 | 9,680 | ||||||||||||||
| Net revenues | $ | 36,441 | $ | 36,016 | $ | 31,496 | |||||||||||
| For the Years Ended December 31, | |||||||||||||||||
| 2024 | 2023 | 2022 | |||||||||||||||
| (in millions) | |||||||||||||||||
| Operating income: | |||||||||||||||||
| Latin America | $ | 532 | $ | 529 | $ | 388 | |||||||||||
| AMEA | 1,192 | 1,113 | 929 | ||||||||||||||
| Europe | 2,068 | 1,978 | 1,481 | ||||||||||||||
| North America | 2,492 | 2,092 | 1,769 | ||||||||||||||
| Unrealized gains/(losses) on hedging activities (mark-to-market impacts) | 543 | 189 | (326) | ||||||||||||||
| General corporate expenses | (330) | (356) | (245) | ||||||||||||||
| Amortization of intangible assets | (153) | (151) | (132) | ||||||||||||||
Gain on acquisition and divestitures | 4 | 108 | — | ||||||||||||||
| Acquisition-related costs | (3) | — | (330) | ||||||||||||||
| Operating income | $ | 6,345 | $ | 5,502 | $ | 3,534 | |||||||||||
48 | | |||||||
Latin America
| For the Years Ended December 31, | |||||||||||||||||||||||
| 2024 | 2023 | $ Change | % Change | ||||||||||||||||||||
| (in millions) | |||||||||||||||||||||||
| Net revenues | $ | 4,926 | $ | 5,006 | $ | (80) | (1.6) | % | |||||||||||||||
| Segment operating income | 532 | 529 | 3 | 0.6 | % | ||||||||||||||||||
| For the Years Ended December 31, | |||||||||||||||||||||||
| 2023 | 2022 | $ Change | % Change | ||||||||||||||||||||
| (in millions) | |||||||||||||||||||||||
| Net revenues | $ | 5,006 | $ | 3,629 | $ | 1,377 | 37.9 | % | |||||||||||||||
| Segment operating income | 529 | 388 | 141 | 36.3 | % | ||||||||||||||||||
2024 compared with 2023
Net revenues decreased $80 million (1.6%), due to unfavorable impact of currency-related items (6.2 pp) and unfavorable volume/mix (2.4 pp), partially offset by higher net pricing (7.0 pp). Currency-related items were unfavorable, net of the adjustment for extreme pricing in Argentina, due to currency translation rate changes. Unfavorable currency translation impacts were primarily due to the strength of the U.S. dollar relative to most currencies in the region, primarily the Argentinean peso, Brazilian real, Mexican peso and Chilean peso, partially offset by the strength of a few currencies relative to the U.S. dollar, primarily the Colombian peso. Overall, unfavorable volume/mix reflected volume declines due to consumer softness, primarily in Mexico and Argentina, partially offset by favorable product mix. Overall, unfavorable volume/mix was driven by declines in chocolate, candy, cheese & grocery and refreshment beverages, partially offset by gains in biscuits & baked snacks and gum. Higher net pricing, net of the adjustment for extreme pricing in Argentina, was driven by input cost-driven pricing actions and reflected across all categories, primarily in Argentina, Mexico and Brazil.
Segment operating income increased $3 million (0.6%), primarily due to higher net pricing, lower remeasurement loss on net monetary position, lower manufacturing costs driven by productivity, lower acquisition integration costs and lower other selling, general and administrative expenses. These favorable items were mostly offset by higher raw material costs, unfavorable currency-related items, unfavorable volume/mix, higher advertising and consumer promotion costs, higher costs incurred for the Simplify to Grow Program, costs incurred for the ERP Systems Implementation program and intangible asset impairment charges incurred in 2024.
2023 compared with 2022
Net revenues increased $1,377 million (37.9%), due to higher net pricing (31.0 pp), the impact of acquisitions (14.0 pp) and favorable volume/mix (3.8 pp), partially offset by unfavorable currency (10.0 pp) and the impact of divestitures (0.9 pp). Higher net pricing was reflected across all categories, driven primarily by Argentina as well as Brazil and Mexico. The November 1, 2022 acquisition of Ricolino added incremental net revenues of $507 million (constant currency basis) through the one-year anniversary of the acquisition in 2023. Favorable volume/mix reflected strong volume growth as the region continued to see increased demand for most of our snack category products. Favorable volume/mix was driven by gains in gum, biscuits & baked snacks, candy and cheese & grocery, partially offset by declines in refreshment beverages and chocolate. Unfavorable currency impacts were primarily due to the strength of the U.S. dollar relative to a few currencies in the region, primarily the Argentinean peso, partially offset by the strength of most currencies relative to the U.S. dollar, primarily the Mexican peso and Brazilian real. The impact of our 2022 divestitures resulted in a year-over-year decline in net revenues of $22 million.
Segment operating income increased $141 million (36.3%), primarily due to higher net pricing, the impact of our Ricolino acquisition, favorable volume/mix, lower manufacturing costs driven by productivity and lapping prior year inventory step-up charges. These favorable items were partially offset by higher raw material costs, higher other selling, general and administrative expenses, higher advertising and consumer promotion costs, higher remeasurement loss on net monetary position and higher acquisition integration costs.
49 | | |||||||
AMEA
| For the Years Ended December 31, | |||||||||||||||||||||||
| 2024 | 2023 | $ Change | % Change | ||||||||||||||||||||
| (in millions) | |||||||||||||||||||||||
| Net revenues | $ | 7,296 | $ | 7,075 | $ | 221 | 3.1 | % | |||||||||||||||
| Segment operating income | 1,192 | 1,113 | 79 | 7.1 | % | ||||||||||||||||||
| For the Years Ended December 31, | |||||||||||||||||||||||
| 2023 | 2022 | $ Change | % Change | ||||||||||||||||||||
| (in millions) | |||||||||||||||||||||||
| Net revenues | $ | 7,075 | $ | 6,767 | $ | 308 | 4.6 | % | |||||||||||||||
| Segment operating income | 1,113 | 929 | 184 | 19.8 | % | ||||||||||||||||||
2024 compared with 2023
Net revenues increased $221 million (3.1%), due to higher net pricing (5.5 pp) the impact of an acquisition (1.0 pp), and favorable volume/mix (0.7 pp), partly offset by unfavorable currency translation rate changes (4.1 pp). Higher net pricing, driven by input cost-driven pricing actions, was reflected across all categories. The November 1, 2024 acquisition of Evirth added incremental net revenues of $72 million (constant currency basis) in 2024. Overall, favorable volume/mix reflected favorable product mix, partially offset by volume declines reflecting the impact of geopolitical events in the region. Favorable volume/mix was driven by gains in gum, biscuits & baked snacks, chocolate and cheese & grocery, partially offset by declines in refreshment beverages and candy. Unfavorable currency translation impacts were due to the strength of the U.S. dollar relative to most currencies in the region, including the Nigerian naira, Egyptian pound, Chinese yuan, Indian rupee, Vietnam dong, Philippine peso and Japanese yen.
Segment operating income increased $79 million (7.1%), primarily due to higher net pricing, lower manufacturing costs driven by productivity and the impact from our Evirth acquisition. These favorable items were partially offset by higher raw material costs, higher advertising and consumer promotion costs, unfavorable currency translation rate changes, higher other selling, general and administrative expenses, unfavorable volume/mix, costs incurred for the ERP Systems Implementation program, higher acquisition integration costs and contingent consideration adjustments and an intangible asset impairment charge incurred in 2024.
2023 compared with 2022
Net revenues increased $308 million (4.6%), due to higher net pricing (8.6 pp) and favorable volume/mix (3.1 pp), partially offset by unfavorable currency (7.1 pp). Higher net pricing, driven by input cost-driven pricing actions, was reflected across all categories. Favorable volume/mix reflected overall volume gains from increased demand for most of our snack category products. Favorable volume/mix was driven by gains in chocolate, gum, candy and refreshment beverages, partially offset by declines in biscuits & baked snacks and cheese & grocery. Unfavorable currency impacts were due to the strength of the U.S. dollar relative to most currencies in the region, including the Egyptian pound, Indian rupee, Chinese yuan, Nigerian naira, Australian dollar, South African Rand, Pakistan rupee and Japanese yen.
Segment operating income increased $184 million (19.8%), primarily due to higher net pricing, favorable volume/mix, lapping prior-year intangible asset impairment charges, lower manufacturing costs driven by productivity and lower costs incurred for the Simplify to Grow Program. These favorable items were partially offset by higher raw material costs, higher advertising and consumer promotion costs, unfavorable currency, higher other selling, general and administrative expenses and higher fixed asset impairment charges.
50 | | |||||||
Europe
| For the Years Ended December 31, | |||||||||||||||||||||||
| 2024 | 2023 | $ Change | % Change | ||||||||||||||||||||
| (in millions) | |||||||||||||||||||||||
| Net revenues | $ | 13,309 | $ | 12,857 | $ | 452 | 3.5 | % | |||||||||||||||
| Segment operating income | 2,068 | 1,978 | 90 | 4.6 | % | ||||||||||||||||||
| For the Years Ended December 31, | |||||||||||||||||||||||
| 2023 | 2022 | $ Change | % Change | ||||||||||||||||||||
| (in millions) | |||||||||||||||||||||||
| Net revenues | $ | 12,857 | $ | 11,420 | $ | 1,437 | 12.6 | % | |||||||||||||||
| Segment operating income | 1,978 | 1,481 | 497 | 33.6 | % | ||||||||||||||||||
2024 compared with 2023
Net revenues increased $452 million (3.5%), due to higher net pricing (7.8 pp), partially offset by unfavorable volume/mix (2.1 pp), the impact of divestitures (1.4 pp) and unfavorable currency translation rate changes (0.8 pp). Higher net pricing, driven by input cost-driven pricing actions, was reflected across all categories except cheese & grocery. Overall, unfavorable volume/mix reflected volume declines due to the impact from customer price negotiation disruptions primarily in the second quarter, partially offset by favorable product mix. Unfavorable volume/mix was driven by declines in chocolate, biscuits & baked snacks, refreshment beverages, candy and gum, partially offset by a gain in cheese & grocery. The impact of our 2023 divestiture of the developed market gum business resulted in a year-over-year reduction in net revenues of $174 million. Unfavorable currency translation rate changes reflected the strength of the U.S. dollar relative to most currencies across the region, including the Turkish lira, Russian ruble and Ukrainian hryvnya, partially offset by the strength of a few currencies relative to the U.S. dollar, including the British pound sterling, Polish zloty and euro.
Segment operating income increased $90 million (4.6%), primarily due to higher net pricing, lower divestiture-related costs, lower impact from the European Commission legal matter, lower costs incurred for the Simplify to Grow Program, lower manufacturing costs driven by productivity and lower remeasurement loss on net monetary position. These favorable items were partially offset by higher raw material costs, higher intangible asset impairment charges, higher advertising and consumer promotion costs, lapping prior-year operating results from the developed market gum business divested in 2023, unfavorable volume/mix, unfavorable currency translation rate changes, higher other selling, general and administrative expenses, costs incurred for the ERP Systems Implementation program and higher fixed asset impairment costs.
2023 compared with 2022
Net revenues increased $1,437 million (12.6%), due to higher net pricing (13.8 pp), favorable volume/mix (0.7 pp) and the impact from short-term distributor agreements (0.2 pp), partially offset by unfavorable currency (1.9 pp) and the impact of divestitures (0.2 pp). Higher net pricing, driven by input cost-driven pricing actions, was reflected across all categories. Overall, volume/mix was favorable driven by improved product mix. Favorable volume/mix was driven by gains in biscuits & baked snacks, chocolate, gum and refreshment beverages, partially offset by declines in cheese & grocery and candy. The short-term distributor agreement related to the October 1, 2023 sale of our developed market gum business added incremental net revenues of $22 million. Unfavorable currency impacts reflected the strength of the U.S. dollar relative to several currencies across the region, including the Russian ruble, Turkish lira, Norwegian krone, Ukrainian hryvnya and Swedish krona, partially offset by the strength of several currencies relative to the U.S. dollar, including the euro, Polish zloty, British pound sterling and Swiss franc. The impact of divestitures reflected a year-over-year decline in net revenues of $4 million from our 2023 divested developed market gum business.
Segment operating income increased $497 million (33.6%), primarily due to higher net pricing, lower impact from the European Commission legal matter, lapping the prior year incremental costs incurred due to the war in Ukraine, lower acquisition integration costs and favorable volume/mix. These favorable items were partially offset by higher raw material costs, higher advertising and consumer promotion costs, unfavorable currency, divestiture-related
51 | | |||||||
costs incurred in 2023, higher costs incurred for the Simplify to Grow Program, higher other selling, general and administrative expenses, higher remeasurement loss on net monetary position, higher manufacturing costs and an intangible asset impairment charge incurred in 2023.
52 | | |||||||
North America
| For the Years Ended December 31, | |||||||||||||||||||||||
| 2024 | 2023 | $ Change | % Change | ||||||||||||||||||||
| (in millions) | |||||||||||||||||||||||
| Net revenues | $ | 10,910 | $ | 11,078 | $ | (168) | (1.5) | % | |||||||||||||||
| Segment operating income | 2,492 | 2,092 | 400 | 19.1 | % | ||||||||||||||||||
| For the Years Ended December 31, | |||||||||||||||||||||||
| 2023 | 2022 | $ Change | % Change | ||||||||||||||||||||
| (in millions) | |||||||||||||||||||||||
| Net revenues | $ | 11,078 | $ | 9,680 | $ | 1,398 | 14.4 | % | |||||||||||||||
| Segment operating income | 2,092 | 1,769 | 323 | 18.3 | % | ||||||||||||||||||
2024 compared with 2023
Net revenues decreased $168 million (1.5%), due to the impact of divestitures (2.8 pp), unfavorable currency translation rate changes (0.2 pp) and flat volume/mix (– pp), partially offset by higher net pricing (1.5 pp). The impact of our 2023 divestiture of the developed market gum business resulted in a year-over-year reduction in net revenues of $310 million. Unfavorable currency translation rate changes were due to the strength of the U.S. dollar relative to the Canadian dollar. Volume/mix was flat for the year as volume trends improved in the second half of 2024 offsetting consumer softness experienced in the U.S. in the first half of 2024. Overall, a volume/mix gain in chocolate was offset by declines in biscuits & baked snacks and candy. Higher net pricing, driven by input cost-driven pricing actions, was reflected across all categories.
Segment operating income increased $400 million (19.1%), primarily due to a favorable contingent consideration adjustment related to Clif Bar as well as lower acquisition integration costs, higher net pricing, lower manufacturing costs due to productivity, lapping prior-year intangible asset impairment charges, lower divestiture-related costs, lower other selling, general and administrative expenses and lower fixed asset impairment charges. These favorable items were partially offset by higher raw material costs, lapping prior-year operating results from the developed market gum business divested in 2023, unfavorable volume/mix, higher costs incurred for the Simplify to Grow Program, higher advertising and consumer promotion costs and costs incurred for the ERP Systems Implementation program.
2023 compared with 2022
Net revenues increased $1,398 million (14.4%), due to higher net pricing (9.5 pp), the impact of acquisitions (5.6 pp) and flat volume/mix (- pp), partially offset by the impact of divestitures (0.4 pp) and unfavorable currency (0.3 pp). Higher net pricing, driven by input cost-driven pricing actions, was reflected across all categories. The August 1, 2022 acquisition of Clif Bar added incremental net revenues of $529 million through the one-year anniversary of the acquisition in 2023. Overall, volume/mix was flat as slight volume gains were offset by unfavorable mix. Flat volume/mix was driven by gains in candy and chocolate offset by a decline in biscuits & baked snacks. While the impact of divestitures reflected a year-over-year increase in net revenues of $12 million (net of the loss of revenue for the fourth quarter) from our 2023 divested developed market gum business, it had a negative impact on the net revenue growth rate as the divested business did not grow as fast as the remaining segment. Unfavorable currency impact was due to the strength of the U.S. dollar relative to the Canadian dollar.
Segment operating income increased $323 million (18.3%), primarily due to higher net pricing, the impact of our Clif Bar acquisition, higher operating results from the divested developed market gum business, lower costs incurred for the Simplify to Grow Program and lapping prior year inventory step-up charges. These favorable items were partially offset by higher raw material costs, higher advertising and consumer promotion costs, higher acquisition integration costs and contingent consideration adjustments, higher other selling, general and administrative expenses, an intangible asset impairment charge incurred in 2023, divestiture-related costs incurred in 2023, unfavorable volume/mix and unfavorable currency.
53 | | |||||||
Liquidity and Capital Resources
We believe that cash from operations, our revolving credit facilities, short-term borrowings and our authorized long-term financing will continue to provide sufficient liquidity for our working capital needs, planned capital expenditures and future payments of our contractual, tax and benefit plan obligations and payments for acquisitions, share repurchases and quarterly dividends. We expect to continue to utilize our commercial paper program and international credit lines as needed. We continually evaluate long-term debt issuances to meet our short- and longer-term funding requirements. We also use intercompany loans with our international subsidiaries to improve financial flexibility. Overall, we do not expect negative effects to our funding sources that would have a material effect on our liquidity, and we continue to monitor our global operations including the impact of ongoing or new conflicts in Ukraine and the Middle East. To date, we have been successful in generating cash and raising financing as needed. However, if a serious economic or credit market crisis ensues or other adverse developments arise, it could have a material adverse effect on our liquidity, results of operations and financial condition.
Our most significant ongoing short-term cash requirements relate primarily to funding operations (including expenditures for raw materials, labor, manufacturing and distribution, trade and promotions, advertising and marketing, tax liabilities, benefit plan obligations and lease expenses) as well as periodic expenditures for acquisitions, shareholder returns (such as dividend payments and share repurchases), property, plant and equipment and any significant one-time non-operating items.
Long-term cash requirements primarily relate to funding long-term debt repayments (refer to Note 9, Debt and Borrowing Arrangements), our U.S. tax reform transition tax liability and deferred taxes (refer to Note 16, Income Taxes), our long-term benefit plan obligations (refer to Note 11, Benefit Plans) and commodity-related purchase commitments and derivative contracts (refer to Note 10, Financial Instruments).
We generally fund short- and long-term cash requirements with cash from operating activities as well as cash proceeds from short- and long-term debt financing (refer to Debt below). We generally do not use equity to fund our ongoing obligations.
For a full discussion related to the financial condition for the fiscal year ended December 31, 2022, including a year-to-year comparison between 2023 and 2022, see Part II, Item 7 - Management’s Discussion and Analysis of Financial Condition and Results of Operations in our Annual Report on Form 10-K for the fiscal year ended December 31, 2023.
Cash Flow
We believe our ability to generate substantial cash from operating activities and readily access capital markets and secure financing at competitive rates are key strengths and give us significant flexibility to meet our short and long-term financial commitments. Our cash flow activity over the last three years is noted below:
| For the Years Ended December 31, | |||||||||||||||||
2024 | 2023 | 2022 | |||||||||||||||
(in millions) | |||||||||||||||||
Net cash provided by/(used in): | |||||||||||||||||
Operating activities | $ | 4,910 | $ | 4,714 | $ | 3,908 | |||||||||||
Investing activities | 526 | 2,812 | (4,888) | ||||||||||||||
Financing activities | (5,780) | (7,558) | (456) | ||||||||||||||
Net Cash Provided by Operating Activities
The increase in net cash provided by operating activities in 2024 was primarily due to an increase in cash-basis net earnings, largely due to operating gains, partially offset by unfavorable year-over-year working capital movements, including the payment of the European Commission matter. Refer to Note 14, Commitments and Contingencies for additional information.
Net Cash Used in/Provided by Investing Activities
The reduction in net cash provided by investing activities was largely driven by lapping prior year proceeds from the developed market gum divestiture combined with lower proceeds from the current year JDEP share sale as compared to the prior year KDP and JDEP share sales, higher capital expenditures and cash consideration paid for the Evirth acquisition. Refer to Note 2, Acquisitions and Divestitures and Note 7, Investments for more information.
54 | | |||||||
Capital expenditures were $1,387 million in 2024, $1,112 million in 2023 and $906 million in 2022. We continue to make capital expenditures primarily to modernize manufacturing facilities and support new product and productivity initiatives. We expect 2025 capital expenditures to be up to $1.4 billion, including capital expenditures in connection with our ERP System Implementation program and for funding our strategic priorities. We expect to continue to fund these expenditures with cash from operations.
Net Cash Used in Financing Activities
The decrease in net cash used in financing activities was primarily due to higher debt proceeds combined with lower debt repayments, partially offset by higher share repurchases and an increase in dividends paid to shareholders in 2024.
Dividends
We paid dividends of $2,349 million in 2024, $2,160 million in 2023 and $1,985 million in 2022. On July 30, 2024, the Audit Committee, with authorization delegated from our Board of Directors, declared a quarterly cash dividend of $0.470 per share of Class A Common Stock, an increase of 11 percent, which would be $1.88 per common share on an annualized basis. The declaration of dividends is subject to the discretion of our Board of Directors and depends on various factors, including our net earnings, financial condition, cash requirements, future prospects and other factors that our Board of Directors deems relevant to its analysis and decision making.
For U.S. income tax purposes only, the Company has determined that 100% of the distributions paid to its shareholders in 2024 are characterized as a qualified dividend paid from U.S. earnings and profits. See Note 13, Capital Stock, to the consolidated financial statements and Item 5, Market for Registrant’s Common Equity, Related Stockholder Matters and Issuer Purchases of Equity Securities – Issuer Purchases of Equity Securities, for information on our share repurchase program.
Guarantees
As discussed in Note 14, Commitments and Contingencies, we enter into third-party guarantees primarily to cover the long-term obligations of our vendors. As part of these transactions, we guarantee that third parties will make contractual payments or achieve performance measures. As of December 31, 2024 and December 31, 2023, we had no material third-party guarantees recorded on our consolidated balance sheets. Guarantees do not have, and we do not expect them to have, a material effect on our liquidity.
Debt
The nature and amount of our long-term and short-term debt and the proportionate amount of each varies as a result of current and expected business requirements, market conditions and other factors. As such, we may issue commercial paper or secure other forms of financing throughout the year to meet short-term working capital or other financing needs.
At our July 2024 meeting, the Board of Directors approved a new $2 billion long-term financing authorization that replaced the prior long-term financing authorization of $2 billion. As of December 31, 2024, $1.5 billion of the long-term financing authorization remained available.
Our total debt was $17.7 billion at December 31, 2024 and $19.4 billion at December 31, 2023. Our debt-to-capitalization ratio was 0.40 at December 31, 2024 and 0.41 at December 31, 2023. The weighted-average term of our outstanding long-term debt was 7.7 years at December 31, 2024 and 7.8 years at December 31, 2023. Our average daily commercial borrowings were $1.1 billion in 2024, $2.1 billion in 2023 and $1.6 billion in 2022.
One of our subsidiaries, Mondelez International Holdings Netherlands B.V. (“MIHN”), has outstanding debt. Refer to Note 9, Debt and Borrowing Arrangements. The operations held by MIHN generated approximately 73.1% (or $26.6 billion) of the $36.4 billion of consolidated net revenue during fiscal year 2024 and represented approximately 81.9% (or $22.1 billion) of the $27.0 billion of net assets as of December 31, 2024.
Refer to Note 9, Debt and Borrowing Arrangements, for more information on our debt and debt covenants.
55 | | |||||||
Commodity Trends
We regularly monitor worldwide supply, commodity cost and currency trends so we can cost-effectively secure ingredients, packaging and fuel required for production. During 2024, the primary drivers of the increase in our aggregate commodity costs were higher cocoa, sugar, nuts and other ingredient costs as well as unfavorable year-over-year currency exchange transaction costs on imported materials, partially offset by lower energy, edible oils, grains, dairy and packaging costs. While the costs of our principal raw materials fluctuate, generally we believe there will continue to be an adequate supply of the raw materials we use and that they will broadly remain available.
A number of external factors such as the current macroeconomic environment, including global inflation, effects of geopolitical uncertainty, climate and weather conditions, commodity, transportation and labor market conditions, exchange rate volatility and the effects of local and global regulations, including trade policies, governmental agricultural or other programs affect the availability and cost of raw materials and agricultural materials used in our products. In particular, the supply of cocoa is exposed to many of these factors, including climate change and weather events, local regulations in cocoa-producing countries, and global regulations such as the EU Deforestation Regulation (which requires companies to ensure that the products they place on the EU market or export from it are not associated with deforestation). These factors could impact the supply of cocoa, which could potentially limit our ability to produce our products and significantly impact profitability.
During 2024, price volatility and the higher aggregate cost environment increased due to international supply chain and labor market disruptions and generally higher commodity, transportation and labor costs. We expect these conditions to continue to impact our aggregate commodity costs. In particular, we expect to face higher cocoa costs in the near- and medium-term due to these factors. For example, the market price for cocoa beans on the Intercontinental Exchange in London was 161% higher on the last trading day of the fourth quarter of 2024 compared to the same day in the fourth quarter of 2023 and it is likely that prices will remain elevated for some time. It is possible that we may not be able to increase prices sufficiently to fully cover the incremental costs of cocoa prices in this environment and/or our hedging strategies may not protect us from increases in cocoa costs, which could result in a significant impact on our profitability.
We address higher commodity costs and currency impacts primarily through hedging, higher pricing and manufacturing and overhead cost control. We use hedging techniques to limit the impact of fluctuations in the cost of our principal raw materials; however, we may not be able to fully hedge against commodity cost changes, such as dairy, where there is a limited ability to hedge, and our hedging strategies may not protect us from increases in specific raw material costs. Our commodity procurement practices are intended to mitigate price volatility and provide visibility to future costs, but also may potentially limit our ability to benefit from possible future price decreases. Additionally, our costs for major raw materials will not necessarily reflect market price fluctuations because of our forward purchasing and hedging practices. Due to competitive or market conditions, planned trade or promotional incentives, fluctuations in currency exchange rates or other factors, our pricing actions may also lag commodity cost changes temporarily.
56 | | |||||||
Non-GAAP Financial Measures
We use non-GAAP financial information and believe it is useful to investors as it provides additional information to facilitate comparisons of historical operating results, identify trends in our underlying operating results and provide additional insight and transparency on how we evaluate our business. We use non-GAAP financial measures to budget, make operating and strategic decisions and evaluate our performance. We have detailed the non-GAAP adjustments that we make in our non-GAAP definitions below. The adjustments generally fall within the following categories: acquisition and divestiture activities, gains and losses on intangible asset sales and non-cash impairments, major program restructuring activities, constant currency and related adjustments, major program financing and hedging activities and other major items affecting comparability of operating results. We believe the non-GAAP measures should always be considered along with the related U.S. GAAP financial measures. We have provided the reconciliations between the GAAP and non-GAAP financial measures along with a discussion of our underlying GAAP results throughout our Management’s Discussion and Analysis of Financial Condition and Results of Operations in this Form 10-K.
Our primary non-GAAP financial measures are listed below and reflect how we evaluate our current and prior year operating results. As new events or circumstances arise, these definitions could change. When our definitions change, we provide the updated definitions and present the related non-GAAP historical results on a comparable basis (1).
•“Organic Net Revenue” is defined as net revenues (the most comparable U.S. GAAP financial measure) excluding the impacts of acquisitions, divestitures (2), short-term distributor agreements related to the sale of a business (3), and currency rate fluctuations (4). We believe that Organic net revenue reflects the underlying growth from the ongoing activities of our business and provides improved comparability of results. We also evaluate Organic Net Revenue growth from emerging markets and developed markets, and these underlying measures are also reconciled to U.S. GAAP above.
•Our emerging markets include our Latin America region in its entirety; the AMEA region, excluding Australia, New Zealand and Japan; and the following countries from the Europe region: Russia, Ukraine, Türkiye, Kazakhstan, Georgia, Poland, Czech Republic, Slovak Republic, Hungary, Bulgaria, Romania, the Baltics and the East Adriatic countries.
•Our developed markets include the entire North America region, the Europe region excluding the countries included in the emerging markets definition, and Australia, New Zealand and Japan from the AMEA region.
•“Adjusted Operating Income” is defined as operating income (the most comparable U.S. GAAP financial measure) excluding the impacts of the Simplify to Grow Program (5); gains or losses (including non-cash impairment charges) on goodwill and intangible assets; divestiture (2) or acquisition gains or losses, divestiture-related costs (6), acquisition-related costs (7), and acquisition integration costs and contingent consideration adjustments (8); inventory step-up charges (9); the operating results of divestitures (2); operating results from short-term distributor agreements related to the sale of a business (3); remeasurement of net monetary position (10); mark-to-market impacts from commodity, forecasted currency and equity method investment transaction derivative contracts (11); impact from resolution of tax matters (12); 2017 malware incident net recoveries; incremental costs due to the war in Ukraine (13); impact from the European Commission legal matter (14); the impact from pension participation changes (15); and operating costs from the ERP System Implementation program (16). We also present “Adjusted Operating Income margin,” which is subject to the same adjustments as Adjusted Operating Income. We also evaluate growth in our Adjusted Operating Income on a constant currency basis (4). We believe these measures provide improved comparability of underlying operating results.
•“Adjusted EPS” is defined as diluted EPS attributable to Mondelēz International (the most comparable U.S. GAAP financial measure) from continuing operations excluding the impacts of the items listed in the Adjusted Operating Income definition as well as losses on debt extinguishment and related expenses; gains or losses on interest rate swaps no longer designated as accounting cash flow hedges due to changed financing and hedging plans; mark-to-market unrealized gains or losses and realized gains or losses from marketable securities (17); initial impacts from enacted tax law changes (18); and gains or losses on equity method investment transactions (19). We also evaluate growth in our Adjusted EPS on a constant currency basis (4). We believe Adjusted EPS provides improved comparability of underlying operating results.
57 | | |||||||
(1)When items no longer impact our current or future presentation of non-GAAP operating results, we remove these items from our non-GAAP definitions. Beginning in Q1 2024, due to a significant devaluation of the Argentinean peso that occurred in December 2023 and the resulting distortion it would cause on our non-GAAP constant currency growth rate measures, we now exclude the impact of pricing in excess of 26% year-over-year ("extreme pricing") in Argentina, which is the level at which hyperinflation generally occurs cumulatively over a 3-year period. We have excluded the impact of extreme pricing in Argentina from our calculation of Organic Net Revenue, Organic Net Revenue growth and other non-GAAP financial constant currency growth measures with a corresponding adjustment to changes in currency exchange rates. We made this change on a prospective basis due to the distorting effect expected in the current period and future periods following the Argentinian peso devaluation that occurred in December 2023 and did not revise our historical non-GAAP constant currency growth measures. Beginning in Q2 2024, we added to the non-GAAP definitions the exclusion of operating expenses associated with the ERP System Implementation program as they represent incremental transformational costs above the normal ongoing level of spending on information technology to support operations (see footnote (16) below).
(2)Divestitures include completed sales of businesses, exits of major product lines upon completion of a sale or licensing agreement, the partial or full sale of an equity method investment and changes from equity method investment accounting to accounting for marketable securities.
(3)In the fourth quarter of 2023, we began to exclude the operating results from short-term distributor agreements that have been executed in conjunction with the sale of a business. We exclude this item to better facilitate comparisons of our underlying operating performance across periods.
(4)Constant currency operating results are calculated by dividing or multiplying, as appropriate, the current-period local currency operating results by the currency exchange rates used to translate the financial statements in the comparable prior year period to determine what the current-period U.S. dollar operating results would have been if the currency exchange rate had not changed from the comparable prior-year period. Beginning in the first quarter of 2024, we also now include within our currency-related impacts a corresponding adjustment associated with the impact of extreme pricing in Argentina.
(5)Non-GAAP adjustments related to the Simplify to Grow Program reflect costs incurred that relate to the objectives of our program to transform our supply chain network and organizational structure. Costs that do not meet the program objectives are not reflected in the non-GAAP adjustments.
(6)Divestiture-related costs, which includes costs incurred in relation to the preparation and completion (including one-time costs such as severance related to the elimination of stranded costs) of our divestitures as defined in footnote (2), also includes costs incurred associated with our publicly-announced processes to sell businesses. We exclude these items to better facilitate comparisons of our underlying operating performance across periods.
(7)Acquisition-related costs, which includes transaction costs such as third party advisor, investment banking and legal fees, also includes one-time compensation expense related to the buyout of non-vested employee stock ownership plan (“ESOP”) shares and realized gains or losses from hedging activities associated with acquisition funds. We exclude these items to better facilitate comparisons of our underlying operating performance across periods.
(8)Acquisition integration costs and contingent consideration adjustments include one-time costs related to the integration of acquisitions as well as any adjustments made to contingent compensation liabilities for earn-outs related to acquisitions that do not relate to recurring employee compensation expense. We exclude these items to better facilitate comparisons of our underlying operating performance across periods. See Note 10, Financial Instruments - Fair Value of Contingent Consideration for additional information.
(9)In the third quarter of 2022, we began to exclude the one-time inventory step-up charges associated with acquired companies related to the fair market valuation of the acquired inventory. We exclude this item to better facilitate comparisons of our underlying operating performance across periods.
(10)In connection with our applying highly inflationary accounting (refer to Note 1, Summary of Significant Accounting Policies), for Argentina (beginning in the third quarter of 2018), Türkiye (beginning in the second quarter of 2022) and Egypt and Nigeria (beginning in the fourth quarter of 2024), we exclude the related remeasurement gains or losses related to remeasuring net monetary assets or liabilities denominated in the local currency to the U.S. dollar during the periods presented and the realized gains and losses from derivatives that mitigate the foreign currency volatility related to the remeasurement of the respective net monetary assets or liabilities during the periods presented.
(11)We exclude unrealized gains and losses (mark-to-market impacts) from outstanding commodity and forecasted currency and equity method investment transaction derivatives from our non-GAAP earnings measures. The mark-to-market impacts of commodity and forecasted currency transaction derivatives are excluded until such time that the related exposures impact our operating results. Since we purchase commodity and forecasted currency transaction contracts to mitigate price volatility primarily for inventory requirements in future periods, we make this adjustment to remove the volatility of these future inventory purchases on current operating results to facilitate comparisons of our underlying operating performance across periods. We exclude equity method investment transaction derivative contract settlements as they represent protection of value for future divestitures.
(12)See Note 14, Commitments and Contingencies, in our Annual Report on Form 10-K for the year ended December 31, 2022.
(13)In February 2022, Russia began a military invasion of Ukraine and we stopped our production and closed our facilities in Ukraine for a period of time due to damage incurred to our facilities during the invasion. We began to incur incremental costs directly related to the war including asset impairments, such as property and inventory losses, higher expected allowances for uncollectible accounts receivable and committed compensation. We have isolated and exclude these costs and related impacts as well as subsequent recoveries from our operating results to facilitate evaluation and comparisons of our ongoing results. Incremental costs related to increasing operations in other primarily European facilities are not included with these costs.
(14)In the fourth quarter of 2022, we began to exclude the impact from the European Commission legal matter. In November 2019, the European Commission informed us that it initiated an investigation into our alleged infringement of European Union competition law through certain practices allegedly restricting cross-border trade within the European Economic Area. On January 28, 2021, the European Commission announced it had taken the next procedural step in its investigation and opened formal proceedings. As of December 31, 2022, we recorded an estimate of the possible cost to resolve this matter. We have cooperated with the investigation and reached a negotiated, resolution to this matter. We subsequently adjusted our accrual accordingly and fulfilled our payment obligation in August 2024. Due to the unique nature of this matter, we believe it to be infrequent and unusual and therefore exclude it to better facilitate comparisons of our underlying operating performance across periods. Refer to Note 14, Commitments and Contingencies for additional information.
(15)The impact from pension participation changes represents the charges incurred when employee groups are withdrawn from multiemployer pension plans and other changes in employee group pension plan participation. We exclude these charges from
58 | | |||||||
our non–GAAP results because those amounts do not reflect our ongoing pension obligations. See Note 11, Benefit Plans, for additional information on the multiemployer pension plan withdrawal.
(16)In July 2024, our Board of Directors approved funding of $1.2 billion for a multi-year systems transformation program to upgrade our global ERP and supply chain systems (the “ERP System Implementation”), which is comprised of both capital expenditures and operating expenses, of which a majority is expected to be operating expenses. The ERP System Implementation program will be implemented in several phases with spending occurring over the next five years, with expected completion by year-end 2028. The operating expenses associated with the ERP System Implementation represent incremental transformational costs above the normal ongoing level of spending on information technology to support operations. These expenses include third-party consulting fees, direct labor costs associated with the program, accelerated depreciation of our existing SAP financial systems and various other expenses, all associated with the implementation of our information technology upgrades. These operating expenses will be excluded from our non-GAAP financial measures as they are nonrecurring and excluding those costs will better facilitate comparisons of our underlying operating performance across periods.
(17)In the first quarter of 2023, we began to exclude mark-to-market unrealized gains or losses, as well as realized gains or losses, associated with our marketable securities from our non-GAAP earnings measures. These marketable securities gains or losses are not indicative of underlying operations and are excluded to better facilitate comparisons of our underlying operating performance across periods.
(18)We have excluded the initial impacts from enacted tax law changes. Initial impacts include items such as the remeasurement of deferred tax balances and the transition tax from the 2017 U.S. tax reform. We exclude initial impacts from enacted tax law changes from our Adjusted EPS as they do not reflect our ongoing tax obligations under the enacted tax law.
(19)We exclude gains and losses on equity method transactions including impairments of our equity method investments. In addition, we also exclude from our non-GAAP financial measures any gains or losses realized on economic hedges on sales proceeds from our equity method investment transactions, which have been recorded in Interest and other expense, net. These items are not indicative of underlying operations and are excluded to better facilitate comparisons of our underlying operating performance across periods.
We believe that the presentation of these non-GAAP financial measures, when considered together with our U.S. GAAP financial measures and the reconciliations to the corresponding U.S. GAAP financial measures, provides a more complete understanding of the factors and trends affecting our business than could be obtained absent these disclosures. Because non-GAAP financial measures vary among companies, the non-GAAP financial measures presented in this report may not be comparable to similarly titled measures used by other companies. Our use of these non-GAAP financial measures is not meant to be considered in isolation or as a substitute for any U.S. GAAP financial measures. A limitation of these non-GAAP financial measures is they exclude items that have an impact on our U.S. GAAP reported results. The best way this limitation can be addressed is by evaluating our non-GAAP financial measures in combination with our U.S. GAAP reported results and carefully evaluating the tables that reconcile U.S. GAAP reported figures to the non-GAAP financial measures in this Form 10-K, which can be found above under Consolidated Results of Operations.
59 | | |||||||
Critical Accounting Estimates
We prepare our consolidated financial statements in conformity with U.S. GAAP. The preparation of these financial statements requires the use of estimates, judgments and assumptions that affect the reported amounts of assets and liabilities at the date of the financial statements and reported amounts of revenues and expenses during the periods presented. Actual results could differ from those estimates and assumptions. Note 1, Summary of Significant Accounting Policies, to the consolidated financial statements includes a summary of the significant accounting policies we used to prepare our consolidated financial statements. We have discussed the selection and disclosure of our critical accounting policies and estimates with our Audit Committee. The following is a review of our most significant assumptions and estimates.
Goodwill and Indefinite-Life Intangible Assets
We review our operating segment and reporting unit structure annually or as significant changes in the organization occur for goodwill testing throughout the year by performing a qualitative review of entity-specific, industry, market and general economic factors affecting our goodwill reporting units. Annually, on July 1, we test goodwill and indefinite-life intangible assets for impairment and may perform qualitative testing, or depending on factors such as prior year test results, current year developments, current risk evaluations and other practical considerations, we may elect to do quantitative testing instead. In our quantitative testing, we compare a reporting unit’s estimated fair value with its carrying value. We estimate a reporting unit’s fair value using a discounted cash flow method which incorporates planned growth rates, market-based discount rates and estimates of residual value. Estimating the fair value of individual reporting units requires us to make assumptions and estimates regarding our future plans and industry and economic conditions based on available information. Given the uncertainty of the global economic environment, those estimates could be significantly different than future performance. If the carrying value of a reporting unit’s net assets exceeds its fair value, we would recognize an impairment charge for the amount by which the carrying value exceeds the reporting unit's fair value.
In 2024, 2023 and 2022, there were no impairments of goodwill. In connection with our 2024 annual impairment testing, each of our reporting units had sufficient fair value in excess of carrying value. While all reporting units passed our annual impairment testing, if planned business performance expectations are not met or specific valuation factors outside of our control, such as discount rates, change significantly, then the estimated fair values of a reporting unit or reporting units might decline and lead to a goodwill impairment in the future.
Annually, we assess indefinite-life intangible assets for impairment by performing a qualitative review and assessing events and circumstances that could affect the fair value or carrying value of these assets. If potential impairment risk exists for a specific asset, we quantitatively test it for impairment by comparing its estimated fair value with its carrying value. We utilize estimates of future sales, earnings growth rates, royalty rates and discount rates in determining a brand’s global fair value. If the carrying value of the asset exceeds its estimated fair value, the asset is impaired and its carrying value is reduced to the estimated fair value.
In 2024, we recorded $153 million of intangible asset impairment charges related to two biscuit brands in the Europe segment, one biscuit brand in the AMEA segment and one candy and one biscuit brand in the Latin America segment. The impairment charges were calculated as the excess of the carrying value over the estimated fair value of the intangible assets on a global basis and were recorded within asset impairment and exit costs. We use several accepted valuation methods, including relief from royalty, excess earnings and excess margin, that utilize estimates of future sales, earnings growth rates, royalty rates and discount rates in determining a brand's global fair value. We identified thirteen brands, as part of our annual test, that each had a fair value in excess of book value of 10% or less. The aggregate value of the thirteen brands was $2.9 billion as of December 31, 2024. We believe our current plans for each of these brands will allow them to not be impaired, but if plans to grow brand revenue and earnings, and expand margin are not met or specific valuation factors outside of our control, such as discount rates change significantly, then a brand or brands could become impaired in the future. In 2023, we recorded $26 million of intangible asset impairment charges related to a chocolate brand in North America and a biscuit brand in Europe. In 2022, we recorded $101 million of intangible asset impairment charges related to two biscuit brands in AMEA.
Refer to Note 6, Goodwill and Intangible Assets, for additional information.
60 | | |||||||
Business Combinations
The assets acquired and liabilities assumed upon the acquisition or consolidation of a business are recorded at fair value, with the residual of the purchase price allocated to goodwill. We engage third-party valuation specialists to assist management in determining the fair values of certain assets acquired and liabilities assumed. In determining fair value, we utilized various forms of the income approach, depending on the asset being valued. Such valuations require management to make significant judgments, estimates and assumptions, especially with respect to intangible assets. Management makes estimates of fair value based upon the best information available at the date of acquisition. These estimates are based upon historical experience and information obtained from the management of the acquired company and are inherently uncertain. Critical estimates in valuing certain of the intangible assets include, but are not limited to: expected future cash flows of the acquired business, discount and royalty rates and economic lives of customer relationships, trade names and fixed assets. Unanticipated events and circumstances may occur, which may affect the accuracy or validity of such assumptions or estimates.
Further, certain of our acquisitions may include earn-out provisions or other forms of contingent consideration. As of the acquisition date, we record contingent consideration, as applicable, at the estimated fair value of expected future payments associated with the earn-out. Any changes to the recorded fair value of contingent consideration will be recognized as expenses or earnings in the period in which they occur. Such contingent consideration liabilities are based on best estimates of future expected payment obligations, which are subject to change due to many factors outside of our control. Changes to the estimate of expected future contingent consideration payments may occur, from time to time, due to various reasons, including changing discount rates as well as actual results differing from estimates and adjustments to the revenue or earnings assumptions used as the basis for the liability based on historical experience.
Trade and Marketing Programs
We promote our products with trade and sales incentives as well as marketing and advertising programs. These programs include, but are not limited to, new product introduction fees, discounts, coupons, rebates and volume-based incentives as well as cooperative advertising, in-store displays and consumer marketing promotions. Trade and sales incentives are recorded as a reduction to revenues based on amounts estimated due to customers and consumers at the end of a period. We base these estimates principally on historical utilization and redemption rates. For interim reporting purposes, advertising and consumer promotion expenses are charged to operations as a percentage of volume, based on estimated sales volume and estimated program spending. We do not defer costs on our year-end consolidated balance sheets and all marketing and advertising costs are recorded as an expense in the year incurred.
Employee Benefit Plans
We sponsor various employee benefit plans worldwide, including primarily pension plans and postretirement healthcare benefits. For accounting purposes, we estimate the pension and postretirement healthcare benefit obligations utilizing assumptions and estimates for discount rates; expected returns on plan assets; expected compensation increases; employee-related factors such as turnover, retirement age and mortality; and health care cost trends. We review our actuarial assumptions on an annual basis and make modifications to the assumptions based on current rates and trends when appropriate. Our assumptions also reflect our historical experiences and management’s best judgment regarding future expectations. These and other assumptions affect the annual expense and obligations recognized for the underlying plans.
We amortize the effect of changes in the assumptions over future periods to reflect the cost or benefit of plan changes, such as increasing or decreasing benefits for prior employee service (prior service cost). These changes are deferred and included in expense on a straight-line basis over the average remaining service period of the employees expected to receive benefits.
Since pension and postretirement liabilities are measured on a discounted basis, the discount rate significantly affects our plan obligations and expenses. For plans that have assets held in trust, the expected return on plan assets assumption affects our pension plan expenses. The assumptions for discount rates and expected rates of return and our process for setting these assumptions are described in Note 11, Benefit Plans, along with additional information on our employee benefit plans.
61 | | |||||||
As a sensitivity measure, a fifty-basis point change in our discount rates or the expected rate of return on plan assets would have the following effects, increase/(decrease), on our annual benefit plan costs:
| As of December 31, 2024 | |||||||||||||||||||||||
| U.S. Plans | Non-U.S. Plans | ||||||||||||||||||||||
| Fifty-Basis-Point | Fifty-Basis-Point | ||||||||||||||||||||||
| Increase | Decrease | Increase | Decrease | ||||||||||||||||||||
| (in millions) | |||||||||||||||||||||||
| Effect of change in discount rate on pension costs | $ | 2 | $ | (2) | $ | (14) | $ | 19 | |||||||||||||||
| Effect of change in expected rate of return on plan assets on pension costs | (7) | 7 | (36) | 36 | |||||||||||||||||||
| Effect of change in discount rate on postretirement health care costs | (1) | 1 | — | — | |||||||||||||||||||
Income Taxes
As a global company, we calculate and provide for income taxes in each tax jurisdiction in which we operate. The provision for income taxes includes the amounts payable or refundable for the current year, the effect of deferred taxes and impacts from uncertain tax positions. Our provision for income taxes is significantly affected by shifts in the geographic mix of our pre-tax earnings across tax jurisdictions, changes in tax laws and regulations, tax planning opportunities available in each tax jurisdiction and the ultimate outcome of various tax audits.
Deferred tax assets and liabilities are recognized for the expected future tax consequences of temporary differences between the financial statement and tax bases of our assets and liabilities and for operating losses and tax credit carryforwards. Deferred tax assets and liabilities are measured using enacted tax rates that will apply to taxable income in the years in which those differences are expected to be recovered or settled. Valuation allowances are established for deferred tax assets when it is more likely than not that a tax benefit will not be realized. We review the realizability assessment on a quarterly basis, including impacts from our latest estimates of future taxable income.
We believe our tax positions comply with applicable tax laws and that we have properly accounted for uncertain tax positions. We recognize tax benefits in our financial statements from uncertain tax positions only if it is more likely than not that the tax position will be sustained by the taxing authorities based on the technical merits of the position. The amount we recognize is measured as the largest amount of benefit that is greater than 50 percent likely of being realized upon resolution. We evaluate uncertain tax positions on an ongoing basis and adjust the amount recognized in light of changing facts and circumstances, such as the progress of a tax audit or expiration of a statute of limitations. We believe the estimates and assumptions used to support our evaluation of uncertain tax positions are reasonable. However, final determination of historical tax liabilities, whether by settlement with tax authorities, judicial or administrative ruling or due to expiration of statutes of limitations, could be materially different from estimates reflected on our consolidated balance sheets and historical income tax provisions. The outcome of these final determinations could have a material effect on our provision for income taxes, net earnings or cash flows in the period in which the determination is made.
See Note 16, Income Taxes, for additional information on our effective tax rate, current and deferred taxes, valuation allowances and unrecognized tax benefits.
Contingencies
See Note 14, Commitments and Contingencies, to the consolidated financial statements.
New Accounting Guidance
See Note 1, Summary of Significant Accounting Policies, to the consolidated financial statements for a discussion of new accounting standards.
62 | | |||||||
Item 7A. Quantitative and Qualitative Disclosures about Market Risk.
As we operate globally, we are primarily exposed to currency exchange rate, commodity price and interest rate market risks. We monitor and manage these exposures as part of our overall risk management program. Our risk management program focuses on the unpredictability of financial markets and seeks to reduce the potentially adverse effects that the volatility of these markets may have on our operating results.
We principally utilize derivative instruments to reduce significant, unanticipated earnings fluctuations that may arise from volatility in currency exchange rates, commodity prices and interest rates. For additional information on our derivative activity and the types of derivative instruments we use to hedge our currency exchange, commodity price and interest rate exposures, see Note 10, Financial Instruments.
Many of our non-U.S. subsidiaries operate in functional currencies other than the U.S. dollar. Fluctuations in currency exchange rates create volatility in our reported results as we translate the balance sheets, operating results and cash flows of these subsidiaries into the U.S. dollar for consolidated reporting purposes. The translation of non-U.S. dollar denominated balance sheets and statements of earnings of our subsidiaries into the U.S. dollar for consolidated reporting generally results in a cumulative translation adjustment to other comprehensive income within equity. A stronger U.S. dollar relative to other functional currencies adversely affects our consolidated earnings and net assets while a weaker U.S. dollar benefits our consolidated earnings and net assets. While we hedge significant forecasted currency exchange transactions as well as certain net assets of non-U.S. operations and other currency impacts, we cannot fully predict or eliminate volatility arising from changes in currency exchange rates on our consolidated financial results. See Consolidated Results of Operations and Results of Operations by Operating Segment under Discussion and Analysis of Historical Results for currency exchange effects on our financial results. Throughout our discussion and analysis of results, we isolate currency impacts and supplementally provide net revenues, operating income and diluted earnings per share on a constant currency basis. For additional information on the impact of currency policies, recent currency devaluations and highly inflationary accounting on our financial condition and results of operations, also see Note 1, Summary of Significant Accounting Policies – Currency Translation and Highly Inflationary Accounting.
We also continually monitor the market for commodities that we use in our products. Input costs may fluctuate widely due to international demand, weather conditions, government policy and regulation and the macroeconomic environment. Refer to Recent Developments and Significant Items Affecting Comparability and Financial Outlook above for updates on recent supply chain, labor and other disruptions that are increasing operating costs and impacting our results. To manage input cost volatility and inflation, we enter into forward purchase agreements and other derivative financial instruments. We also pursue productivity and cost saving measures and take pricing actions when necessary to mitigate the impact of higher input costs on earnings.
We regularly evaluate our variable and fixed-rate debt as well as current and expected interest rates in the markets in which we raise capital. Our primary exposures include movements in U.S. Treasury rates, corporate credit spreads, commercial paper rates as well as limited debt tied to Secured Overnight Financing Rates (“SOFR”). We periodically use interest rate swaps and forward interest rate contracts to achieve a desired proportion of variable versus fixed-rate debt based on current and projected market conditions. For more information on our debt activity, see Note 9, Debt and Borrowing Arrangements.
See Note 10, Financial Instruments, for more information on our derivative activity.
Value at Risk
We use a value at risk (“VAR”) computation to estimate: 1) the potential one-day loss in the fair value of our interest rate-sensitive financial instruments; and 2) the potential one-day loss in pre-tax earnings of our currency and commodity price-sensitive derivative financial instruments. The VAR analysis was done separately as of each quarter end for our currency exchange, fixed income and commodity risk portfolios using historical market movements. The instruments included in the VAR computation were currency exchange forwards and options for currency exchange risk, debt and swaps for interest rate risk, and commodity forwards, futures and options for commodity risk. Excluded from the computation were anticipated transactions, currency trade payables and receivables, and net investments in non-U.S. subsidiaries, which the above-mentioned instruments are intended to hedge.
63 | | |||||||
The VAR model assumes normal market conditions, a 95% confidence interval and a one-day holding period. A parametric delta-gamma approximation technique was used to determine the expected return distribution in interest rates, currencies and commodity prices for the purpose of calculating the fixed income, currency exchange and commodity VAR, respectively. The parameters used for estimating the expected return distributions were determined by observing interest rate, currency exchange and commodity price movements over the prior quarter for the calculation of VAR amounts at December 31, 2024 and 2023, and over each of the four prior quarters for the calculation of average VAR amounts during each year. The values of currency and commodity options do not change on a one-to-one basis with the underlying currency or commodity and were valued accordingly in the VAR computation.
As of December 31, 2024 and December 31, 2023, the estimated potential one-day loss in fair value of our interest rate-sensitive instruments, primarily debt, and the estimated potential one-day loss in pre-tax earnings from our currency and commodity instruments, as calculated in the VAR model, were:
| Pre-Tax Earnings Impact | Fair Value Impact | ||||||||||||||||||||||||||||||||||||||||||||||
| At 12/31/24 | Average | High | Low | At 12/31/24 | Average | High | Low | ||||||||||||||||||||||||||||||||||||||||
| (in millions) | |||||||||||||||||||||||||||||||||||||||||||||||
| Instruments sensitive to: | |||||||||||||||||||||||||||||||||||||||||||||||
| Interest rates | $ | 76 | $ | 84 | $ | 95 | $ | 76 | |||||||||||||||||||||||||||||||||||||||
| Foreign currency rates | $ | 22 | $ | 34 | $ | 46 | $ | 22 | |||||||||||||||||||||||||||||||||||||||
| Commodity prices | 21 | 49 | 99 | 14 | |||||||||||||||||||||||||||||||||||||||||||
| Pre-Tax Earnings Impact | Fair Value Impact | ||||||||||||||||||||||||||||||||||||||||||||||
| At 12/31/23 | Average | High | Low | At 12/31/23 | Average | High | Low | ||||||||||||||||||||||||||||||||||||||||
| (in millions) | |||||||||||||||||||||||||||||||||||||||||||||||
| Instruments sensitive to: | |||||||||||||||||||||||||||||||||||||||||||||||
| Interest rates | $ | 119 | $ | 144 | $ | 234 | $ | 89 | |||||||||||||||||||||||||||||||||||||||
| Foreign currency rates | $ | 14 | $ | 17 | $ | 18 | $ | 14 | |||||||||||||||||||||||||||||||||||||||
| Commodity prices | 21 | 40 | 86 | 18 | |||||||||||||||||||||||||||||||||||||||||||
This VAR computation is a risk analysis tool designed to statistically estimate the maximum expected daily loss, under the specified confidence interval and assuming normal market conditions, from adverse movements in interest rates, currency exchange rates and commodity prices. The computation does not represent actual losses in fair value or earnings we will incur, nor does it consider the effect of favorable changes in market rates. We cannot predict actual future movements in market rates and do not present these VAR results to be indicative of future movements in market rates or to be representative of any actual impact that future changes in market rates may have on our future financial results.
64 | | |||||||
Item 8. Financial Statements and Supplementary Data.
Report of Independent Registered Public Accounting Firm
To the Board of Directors and Shareholders of Mondelēz International, Inc.
Opinions on the Financial Statements and Internal Control over Financial Reporting
We have audited the accompanying consolidated balance sheets of Mondelēz International, Inc. and its subsidiaries (the “Company”) as of December 31, 2024 and 2023, and the related consolidated statements of earnings, comprehensive earnings, equity and cash flows for each of the three years in the period ended December 31, 2024, including the related notes (collectively referred to as the “consolidated financial statements”). We also have audited the Company's internal control over financial reporting as of December 31, 2024, based on criteria established in Internal Control - Integrated Framework (2013) issued by the Committee of Sponsoring Organizations of the Treadway Commission (COSO).
In our opinion, the consolidated financial statements referred to above present fairly, in all material respects, the financial position of the Company as of December 31, 2024 and 2023, and the results of its operations and its cash flows for each of the three years in the period ended December 31, 2023 in conformity with accounting principles generally accepted in the United States of America. Also in our opinion, the Company maintained, in all material respects, effective internal control over financial reporting as of December 31, 2024, based on criteria established in Internal Control - Integrated Framework (2013) issued by the COSO.
Basis for Opinions
The Company's management is responsible for these consolidated financial statements, for maintaining effective internal control over financial reporting, and for its assessment of the effectiveness of internal control over financial reporting, included in the Report of Management on Internal Control Over Financial Reporting appearing under Item 9A. Our responsibility is to express opinions on the Company’s consolidated financial statements and on the Company's internal control over financial reporting based on our audits. We are a public accounting firm registered with the Public Company Accounting Oversight Board (United States) (PCAOB) and are required to be independent with respect to the Company in accordance with the U.S. federal securities laws and the applicable rules and regulations of the Securities and Exchange Commission and the PCAOB.
We conducted our audits in accordance with the standards of the PCAOB. Those standards require that we plan and perform the audits to obtain reasonable assurance about whether the consolidated financial statements are free of material misstatement, whether due to error or fraud, and whether effective internal control over financial reporting was maintained in all material respects.
Our audits of the consolidated financial statements included performing procedures to assess the risks of material misstatement of the consolidated financial statements, whether due to error or fraud, and performing procedures that respond to those risks. Such procedures included examining, on a test basis, evidence regarding the amounts and disclosures in the consolidated financial statements. Our audits also included evaluating the accounting principles used and significant estimates made by management, as well as evaluating the overall presentation of the consolidated financial statements. Our audit of internal control over financial reporting included obtaining an understanding of internal control over financial reporting, assessing the risk that a material weakness exists, and testing and evaluating the design and operating effectiveness of internal control based on the assessed risk. Our audits also included performing such other procedures as we considered necessary in the circumstances. We believe that our audits provide a reasonable basis for our opinions.
As described in the Report of Management on Internal Control Over Financial Reporting, management has excluded Evirth (Shanghai) Industrial Co., Ltd (“Evirth”) from its assessment of internal control over financial reporting as of December 31, 2024 because it was acquired by the Company in a purchase business combination during 2024. We have also excluded Evirth from our audit of internal control over financial reporting. Evirth is a majority-owned subsidiary whose total assets and total net revenues excluded from management’s assessment and our audit of internal control over financial reporting represent 0.37% and 0.19%, respectively, of the related consolidated financial statement amounts as of and for the year ended December 31, 2024.
65 | | |||||||
Definition and Limitations of Internal Control over Financial Reporting
A company’s internal control over financial reporting is a process designed to provide reasonable assurance regarding the reliability of financial reporting and the preparation of financial statements for external purposes in accordance with generally accepted accounting principles. A company’s internal control over financial reporting includes those policies and procedures that (i) pertain to the maintenance of records that, in reasonable detail, accurately and fairly reflect the transactions and dispositions of the assets of the company; (ii) provide reasonable assurance that transactions are recorded as necessary to permit preparation of financial statements in accordance with generally accepted accounting principles, and that receipts and expenditures of the company are being made only in accordance with authorizations of management and directors of the company; and (iii) provide reasonable assurance regarding prevention or timely detection of unauthorized acquisition, use, or disposition of the company’s assets that could have a material effect on the financial statements.
Because of its inherent limitations, internal control over financial reporting may not prevent or detect misstatements. Also, projections of any evaluation of effectiveness to future periods are subject to the risk that controls may become inadequate because of changes in conditions, or that the degree of compliance with the policies or procedures may deteriorate.
Critical Audit Matters
The critical audit matter communicated below is a matter arising from the current period audit of the consolidated financial statements that was communicated or required to be communicated to the audit committee and that (i) relates to accounts or disclosures that are material to the consolidated financial statements and (ii) involved our especially challenging, subjective, or complex judgments. The communication of critical audit matters does not alter in any way our opinion on the consolidated financial statements, taken as a whole, and we are not, by communicating the critical audit matter below, providing a separate opinion on the critical audit matter or on the accounts or disclosures to which it relates.
Indefinite-Life Intangible Assets Annual Impairment Assessments for Certain Brand Names
As described in Notes 1 and 6 to the consolidated financial statements, the Company’s consolidated indefinite-life intangible assets balance was $17.8 billion as of December 31, 2024, which consists principally of brand names. At least annually management assesses indefinite-life intangible assets for impairment and if significant potential impairment risk exists for a specific asset, management quantitatively tests the asset for impairment by comparing its estimated fair value with its carrying value. Management estimates fair value using several accepted valuation methods, including relief from royalty, excess earnings and excess margin, that utilize estimates of future sales, earnings growth rates, royalty rates and discount rates to determine a brand name’s fair value.
The principal considerations for our determination that performing procedures relating to the indefinite-life intangible assets annual impairment assessments for certain brand names is a critical audit matter are (i) the significant judgment by management when developing the fair value of the indefinite-life intangible assets for certain brand names; (ii) a high degree of auditor judgment, subjectivity, and effort in performing procedures and evaluating management’s significant assumptions related to estimates of future sales, earnings growth rates, royalty rates, and discount rates for certain brand names; and (iii) the audit effort involved the use of professionals with specialized skill and knowledge.
Addressing the matter involved performing procedures and evaluating audit evidence in connection with forming our overall opinion on the consolidated financial statements. These procedures included testing the effectiveness of controls relating to the indefinite-life intangible assets impairment assessments, including controls over the annual valuation of certain brand names. These procedures also included, among others (i) testing management’s process for developing the fair value of the indefinite-life intangible assets for certain brand names; (ii) evaluating the appropriateness of the valuation methods; (iii) testing the completeness and accuracy of underlying data used in the valuation methods; and (iv) evaluating the reasonableness of the significant assumptions used by management related to estimates of future sales, earnings growth rates, royalty rates, and discount rates. Evaluating management’s significant assumptions related to estimates of future sales and earnings growth rates involved evaluating whether the assumptions used by management were reasonable considering (i) the current and past performance of the certain brand names; (ii) the consistency with external market and industry data; and (iii) whether these assumptions were consistent with evidence obtained in other areas of the audit. Professionals with
66 | | |||||||
specialized skill and knowledge were used to assist in evaluating (i) the appropriateness of the Company’s valuation methods and (ii) the reasonableness of the royalty rate and discount rate significant assumptions.
/s/ PricewaterhouseCoopers LLP
February 5, 2025
We have served as the Company’s auditor since 2001.
67 | | |||||||
Mondelēz International, Inc. and Subsidiaries
Consolidated Statements of Earnings
For the Years Ended December 31
(in millions of U.S. dollars, except per share data)
| 2024 | 2023 | 2022 | |||||||||||||||
| Net revenues | $ | $ | $ | ||||||||||||||
| Cost of sales | ( | ( | ( | ||||||||||||||
| Gross profit | |||||||||||||||||
| Selling, general and administrative expenses | ( | ( | ( | ||||||||||||||
| Asset impairment and exit costs | ( | ( | ( | ||||||||||||||
Gain on acquisition and divestitures | |||||||||||||||||
| Amortization of intangible assets | ( | ( | ( | ||||||||||||||
| Operating income | |||||||||||||||||
Benefit plan non-service income | |||||||||||||||||
| Interest and other expense, net | ( | ( | ( | ||||||||||||||
Gain on marketable securities | |||||||||||||||||
| Earnings before income taxes | |||||||||||||||||
| Income tax provision | ( | ( | ( | ||||||||||||||
(Loss)/gain on equity method investment transactions | ( | ( | |||||||||||||||
| Equity method investment net earnings | |||||||||||||||||
| Net earnings | |||||||||||||||||
less: Noncontrolling interest earnings | ( | ( | ( | ||||||||||||||
| Net earnings attributable to Mondelēz International | $ | $ | $ | ||||||||||||||
| Per share data: | |||||||||||||||||
| Basic earnings per share attributable to Mondelēz International | $ | $ | $ | ||||||||||||||
| Diluted earnings per share attributable to Mondelēz International | $ | $ | $ | ||||||||||||||
See accompanying notes to the consolidated financial statements.
68 | | |||||||
Mondelēz International, Inc. and Subsidiaries
Consolidated Statements of Comprehensive Earnings
For the Years Ended December 31
(in millions of U.S. dollars)
| 2024 | 2023 | 2022 | |||||||||||||||
| Net earnings | $ | $ | $ | ||||||||||||||
| Other comprehensive earnings/(losses), net of tax: | |||||||||||||||||
| Currency translation adjustment | ( | ( | |||||||||||||||
| Pension and other benefit plans | ( | ( | |||||||||||||||
| Derivative cash flow hedges | ( | ( | |||||||||||||||
| Total other comprehensive earnings/(losses) | ( | ( | ( | ||||||||||||||
| Comprehensive earnings | |||||||||||||||||
| less: Comprehensive earnings/(losses) attributable to noncontrolling interests | ( | ( | |||||||||||||||
| Comprehensive earnings attributable to Mondelēz International | $ | $ | $ | ||||||||||||||
See accompanying notes to the consolidated financial statements.
69 | | |||||||
Mondelēz International, Inc. and Subsidiaries
Consolidated Balance Sheets, as of December 31
(in millions of U.S. dollars, except share data)
| 2024 | 2023 | ||||||||||
| ASSETS | |||||||||||
| Cash and cash equivalents | $ | $ | |||||||||
Trade receivables, less allowance ($ | |||||||||||
Other receivables, less allowance ($ | |||||||||||
| Inventories, net | |||||||||||
| Other current assets | |||||||||||
| Total current assets | |||||||||||
| Property, plant and equipment, net | |||||||||||
Operating lease right-of-use assets | |||||||||||
| Goodwill | |||||||||||
| Intangible assets, net | |||||||||||
| Prepaid pension assets | |||||||||||
| Deferred income taxes | |||||||||||
| Equity method investments | |||||||||||
| Other assets | |||||||||||
| TOTAL ASSETS | $ | $ | |||||||||
| LIABILITIES | |||||||||||
| Short-term borrowings | $ | $ | |||||||||
| Current portion of long-term debt | |||||||||||
| Accounts payable | |||||||||||
| Accrued marketing | |||||||||||
| Accrued employment costs | |||||||||||
| Other current liabilities | |||||||||||
| Total current liabilities | |||||||||||
| Long-term debt | |||||||||||
| Long-term operating lease liabilities | |||||||||||
| Deferred income taxes | |||||||||||
| Accrued pension costs | |||||||||||
| Accrued postretirement health care costs | |||||||||||
| Other liabilities | |||||||||||
| TOTAL LIABILITIES | |||||||||||
| Commitments and Contingencies (Note 14) | |||||||||||
| EQUITY | |||||||||||
Common Stock, no par value ( shares issued) | |||||||||||
| Additional paid-in capital | |||||||||||
| Retained earnings | |||||||||||
| Accumulated other comprehensive losses | ( | ( | |||||||||
Treasury stock, at cost ( | ( | ( | |||||||||
| Total Mondelēz International Shareholders’ Equity | |||||||||||
| Noncontrolling interest | |||||||||||
| TOTAL EQUITY | |||||||||||
| TOTAL LIABILITIES AND EQUITY | $ | $ | |||||||||
See accompanying notes to the consolidated financial statements.
70 | | |||||||
Mondelēz International, Inc. and Subsidiaries
Consolidated Statements of Equity
(in millions of U.S. dollars, except per share data)
| Mondelēz International Shareholders’ Equity | |||||||||||||||||||||||||||||||||||||||||
| Common Stock | Additional Paid-in Capital | Retained Earnings | Accumulated Other Comprehensive Earnings/ (Losses) | Treasury Stock | Non-controlling Interest | Total Equity | |||||||||||||||||||||||||||||||||||
| Balances at January 1, 2022 | $ | $ | $ | $ | ( | $ | ( | $ | $ | ||||||||||||||||||||||||||||||||
| Comprehensive earnings/(losses): | |||||||||||||||||||||||||||||||||||||||||
| Net earnings | — | — | — | — | |||||||||||||||||||||||||||||||||||||
| Other comprehensive earnings/ (losses), net of income taxes | — | — | — | ( | — | ( | ( | ||||||||||||||||||||||||||||||||||
| Exercise of stock options and issuance of other stock awards | — | ( | — | — | |||||||||||||||||||||||||||||||||||||
| Common Stock repurchased | — | — | — | — | ( | — | ( | ||||||||||||||||||||||||||||||||||
Cash dividends declared ($ | — | — | ( | — | — | — | ( | ||||||||||||||||||||||||||||||||||
| Dividends paid on noncontrolling interest and other activities | — | — | — | — | ( | ( | |||||||||||||||||||||||||||||||||||
| Balances at December 31, 2022 | $ | $ | $ | $ | ( | $ | ( | $ | $ | ||||||||||||||||||||||||||||||||
| Comprehensive earnings/(losses): | |||||||||||||||||||||||||||||||||||||||||
| Net earnings | — | — | — | — | |||||||||||||||||||||||||||||||||||||
| Other comprehensive earnings/ (losses), net of income taxes | — | — | — | — | ( | ( | |||||||||||||||||||||||||||||||||||
| Exercise of stock options and issuance of other stock awards | — | ( | — | — | |||||||||||||||||||||||||||||||||||||
| Common Stock repurchased | — | — | — | — | ( | — | ( | ||||||||||||||||||||||||||||||||||
Cash dividends declared ($ | — | — | ( | — | — | — | ( | ||||||||||||||||||||||||||||||||||
| Dividends paid on noncontrolling interest and other activities | — | — | — | — | ( | ||||||||||||||||||||||||||||||||||||
| Balances at December 31, 2023 | $ | $ | $ | $ | ( | $ | ( | $ | $ | ||||||||||||||||||||||||||||||||
| Comprehensive earnings/(losses): | |||||||||||||||||||||||||||||||||||||||||
| Net earnings | — | — | — | — | |||||||||||||||||||||||||||||||||||||
| Other comprehensive earnings/ (losses), net of income taxes | — | — | — | ( | — | ( | ( | ||||||||||||||||||||||||||||||||||
| Exercise of stock options and issuance of other stock awards | — | — | — | ||||||||||||||||||||||||||||||||||||||
| Common Stock repurchased | — | — | — | — | ( | — | ( | ||||||||||||||||||||||||||||||||||
Cash dividends declared ($ | — | — | ( | — | — | — | ( | ||||||||||||||||||||||||||||||||||
| Dividends paid on noncontrolling interest and other activities | — | — | — | — | ( | ||||||||||||||||||||||||||||||||||||
| Balances at December 31, 2024 | $ | $ | $ | $ | ( | $ | ( | $ | $ | ||||||||||||||||||||||||||||||||
See accompanying notes to the consolidated financial statements.
71 | | |||||||
Mondelēz International, Inc. and Subsidiaries
Consolidated Statements of Cash Flows
For the Years Ended December 31
(in millions of U.S. dollars)
| 2024 | 2023 | 2022 | |||||||||||||||
| CASH PROVIDED BY/(USED IN) OPERATING ACTIVITIES | |||||||||||||||||
| Net earnings | $ | $ | $ | ||||||||||||||
| Adjustments to reconcile net earnings to operating cash flows: | |||||||||||||||||
| Depreciation and amortization | |||||||||||||||||
| Stock-based compensation expense | |||||||||||||||||
Deferred income tax provision/(benefit) | ( | ( | |||||||||||||||
| Asset impairments and accelerated depreciation | |||||||||||||||||
Gain on acquisition and divestitures | ( | ( | |||||||||||||||
Loss/(gain) on equity method investment transactions | ( | ||||||||||||||||
| Equity method investment net earnings | ( | ( | ( | ||||||||||||||
| Distributions from equity method investments | |||||||||||||||||
Unrealized (gain)/loss on derivative contracts | ( | ( | |||||||||||||||
Gain on marketable securities | ( | ||||||||||||||||
Contingent consideration adjustments | ( | ||||||||||||||||
| Other non-cash items, net | |||||||||||||||||
| Change in assets and liabilities, net of acquisitions and divestitures: | |||||||||||||||||
| Receivables, net | ( | ( | ( | ||||||||||||||
| Inventories, net | ( | ( | ( | ||||||||||||||
| Accounts payable | |||||||||||||||||
| Other current assets | ( | ( | ( | ||||||||||||||
| Other current liabilities | ( | ||||||||||||||||
| Change in pension and postretirement assets and liabilities, net | ( | ( | ( | ||||||||||||||
| Net cash provided by operating activities | |||||||||||||||||
| CASH PROVIDED BY/(USED IN) INVESTING ACTIVITIES | |||||||||||||||||
| Capital expenditures | ( | ( | ( | ||||||||||||||
| Acquisitions, net of cash received | ( | ( | |||||||||||||||
Proceeds from divestitures including equity method and marketable security investments | |||||||||||||||||
| Proceeds from derivative settlements | |||||||||||||||||
| Payments for derivative settlements | ( | ( | ( | ||||||||||||||
| Contributions to investments | ( | ( | ( | ||||||||||||||
Proceeds from sale of property, plant and equipment and other | |||||||||||||||||
| Net cash provided by/(used in) by investing activities | ( | ||||||||||||||||
| CASH PROVIDED BY/(USED IN) FINANCING ACTIVITIES | |||||||||||||||||
| Issuances of commercial paper, maturities greater than 90 days | |||||||||||||||||
| Repayments of commercial paper, maturities greater than 90 days | ( | ||||||||||||||||
Net (repayments)/issuances of short-term borrowings | ( | ( | |||||||||||||||
| Long-term debt proceeds | |||||||||||||||||
| Long-term debt repayments | ( | ( | ( | ||||||||||||||
| Repurchases of Common Stock | ( | ( | ( | ||||||||||||||
| Dividends paid | ( | ( | ( | ||||||||||||||
| Other | |||||||||||||||||
| Net cash used in financing activities | ( | ( | ( | ||||||||||||||
Effect of exchange rate changes on cash, cash equivalents and restricted cash | ( | ( | ( | ||||||||||||||
| Cash, cash equivalents and restricted cash: | |||||||||||||||||
| Decrease | ( | ( | ( | ||||||||||||||
| Balance at beginning of period | |||||||||||||||||
| Balance at end of period | $ | $ | $ | ||||||||||||||
| Cash paid: | |||||||||||||||||
| Interest | $ | $ | $ | ||||||||||||||
| Income taxes | $ | $ | $ | ||||||||||||||
See accompanying notes to the consolidated financial statements.
72 | | |||||||
Mondelēz International, Inc. and Subsidiaries
Notes to Consolidated Financial Statements
Note 1. Summary of Significant Accounting Policies
Description of Business
Mondelēz International, Inc. was incorporated in 2000 in the Commonwealth of Virginia. Mondelēz International, Inc., through its subsidiaries (collectively “Mondelēz International,” “we,” “us” and “our”), sells food and beverage products to consumers in over 150 countries.
Principles of Consolidation
The consolidated financial statements include Mondelēz International, Inc. as well as our wholly owned and majority owned subsidiaries, except our Venezuelan subsidiaries that were deconsolidated in 2015. All intercompany transactions are eliminated. The noncontrolling interest represents the noncontrolling investors’ interests in the results of subsidiaries that we control and consolidate. We account for investments over which we exercise significant influence under the equity method of accounting. Investments over which we do not have significant influence or control are not material and as there is no readily determinable fair value for the equity interests, these investments are carried at cost with changes in the investment recognized to the extent cash is received.
Use of Estimates
War in Ukraine
In February 2022, Russia began a military invasion of Ukraine and we closed our operations and facilities in Ukraine. In March 2022, our two Ukrainian manufacturing facilities in Trostyanets and Vyshhorod were significantly damaged. During the first quarter of 2022, we evaluated and impaired these and other related assets. We recorded $143 million of total expenses ($145 million after-tax) incurred as a direct result of the war. We reversed $22 million during the remainder of 2022 of previously recorded charges primarily as a result of higher than expected collection of trade receivables and inventory recoveries. In the second quarter of 2024, we fully resumed production at both facilities after completing targeted repairs. We continue to consolidate both our Ukrainian and Russian subsidiaries and continue to evaluate our ability to control our operating activities and businesses on an ongoing basis. We continue to evaluate the uncertainty of the ongoing effects of the war in Ukraine and its impact on the global economic environment, and we cannot predict if it will have a significant impact in the future.
Currency Translation and Highly Inflationary Accounting
We translate the results of operations of our subsidiaries from multiple currencies using average exchange rates during each period and translate balance sheet accounts using exchange rates at the end of each period. We record currency translation adjustments as a component of equity (except for highly inflationary currencies) and realized exchange gains and losses on transactions in earnings.
Highly inflationary accounting is triggered when a country’s three-year cumulative inflation rate exceeds 100%. It requires the remeasurement of financial statements of subsidiaries in the country, from the functional currency of the subsidiary to our U.S. dollar reporting currency, with currency remeasurement gains or losses recorded in earnings.
During the fourth quarter of 2024, primarily based on published estimates indicating three-year cumulative inflation rates exceeding 100% for Egypt and Nigeria, we concluded that both countries became highly inflationary economies for accounting purposes. We began to apply highly inflationary accounting for our subsidiaries operating in Egypt and Nigeria and changed their functional currencies from the Egyptian Pound and Nigerian Naira, respectively, to the U.S. dollar during the fourth quarter of 2024.
73 | | |||||||
The share of our remeasurement gains/(losses) for the highly inflationary countries are summarized as follows (1):
| Year Ended December 31, | |||||||||||||||||
| 2024 | 2023 | 2022 | |||||||||||||||
(in millions) | |||||||||||||||||
Argentina | $ | ( | $ | ( | $ | ( | |||||||||||
Türkiye | ( | ( | ( | ||||||||||||||
Total losses | $ | ( | $ | ( | $ | ( | |||||||||||
(1)Remeasurement gains for Egypt and Nigeria were not
Cash, Cash Equivalents and Restricted Cash
Allowances for Credit Losses
Allowances for credit losses are recorded against our receivables. They are developed at a country and region level based on historical collection experiences, current economic condition of specific customers and the forecasted economic condition of countries using various factors such as bond default rates and consumption indexes. We write off receivables once it is determined that the receivables are no longer collectible and as allowed by local laws.
Changes in allowances for credit losses consisted of:
| Allowance for Trade Receivables | Allowance for Other Current Receivables | Allowance for Long-Term Receivables | |||||||||||||||
| (in millions) | |||||||||||||||||
| Balance at January 1, 2023 | $ | ( | $ | ( | $ | ( | |||||||||||
Net (provision)/recovery for expected credit losses | ( | ||||||||||||||||
| Write-offs charged against the allowance | |||||||||||||||||
| Recoveries of amounts previously written off | ( | ( | |||||||||||||||
| Currency | ( | ( | |||||||||||||||
| Balance at December 31, 2023 | ( | ( | ( | ||||||||||||||
Net recovery/(provision) for expected credit losses | ( | ||||||||||||||||
| Write-offs charged against the allowance | |||||||||||||||||
| Currency | ( | ||||||||||||||||
| Balance at December 31, 2024 | $ | ( | $ | ( | $ | ( | |||||||||||
Transfers of Financial Assets
74 | | |||||||
incremental costs of factoring receivables under these arrangements were not material for all periods presented. The proceeds from the sales of receivables are included in cash from operating activities in the consolidated statements of cash flows.
Inventories
We record our inventory using the average cost method and record inventory reserves for excess and obsolete inventory.
Long-Lived Assets
Property, plant and equipment are stated at historical cost and depreciated by the straight-line method over the estimated useful lives of the assets with the expense recorded in cost of sales or selling, general and administrative expenses depending on the nature of the long-lived assets. Machinery and equipment are depreciated over periods ranging from 3 to 20 years and buildings and building improvements over periods up to 40 years.
We review long-lived assets, including definite-life intangible assets, for realizability on an ongoing basis. Changes in depreciation, generally accelerated depreciation, are determined and recorded when estimates of the remaining useful lives or residual values of long-term assets change. We amortize definite-life intangible assets over their estimated useful lives and evaluate them for impairment as we do other long-lived assets. We review for impairment when conditions exist that indicate the carrying amount of the assets may not be fully recoverable. In those circumstances, we perform undiscounted operating cash flow analyses for asset groups at the lowest level for which cash flows are separately identifiable to determine if an impairment exists. Any impairment loss is calculated as the excess of the asset’s carrying value over its estimated fair value. Fair value is estimated based on the discounted cash flows for the asset group over the remaining useful life or based on the expected cash proceeds for the asset less costs of disposal.
Leases
We determine whether a contract is or contains a lease at contract inception. For short-term operating leases with terms of 12 months or less, we do not recognize right-of-use (“ROU”) assets and lease liabilities. ROU assets are recognized at commencement date at the value of the lease liability, adjusted for any prepayments, lease incentives received and initial direct costs incurred. Lease liabilities are recognized at commencement date based on the present value of remaining lease payments over the lease term. The non-recurring fair value measurement is classified as Level 3 as no fair value inputs are observable. As the implicit interest rate in the lease is not readily determinable, we use our country-specific incremental borrowing rate to discount the lease liabilities.
Our leases may include options to extend or terminate the lease, which are included in the lease term when it is reasonably certain that we will exercise that option. Our lease agreements do not contain any material residual value guarantees or material restrictive covenants. Many of our leases contain non-lease components (e.g., product costs, common-area or other maintenance costs) that relate to the lease components of the agreement. We account for lease and non-lease components as a single lease component.
Internal Use Software Costs
We capitalize certain computer software and software development costs incurred in connection with developing or obtaining computer software for internal use. Capitalized software costs are included in property, plant and equipment and amortized on a straight-line basis over the estimated useful lives of the software, which do not exceed seven years .
Cloud Computing Arrangements
We capitalize certain implementation costs of cloud computing arrangements during the application-development stage, consistent with the capitalization criteria used for internal use software. Capitalized costs are recorded to other assets on the consolidated balance sheets and within net cash provided by operating activities on the
75 | | |||||||
consolidated statement of cash flows. Capitalized cloud computing arrangement implementation costs are amortized using the straight-line method over the remaining term of the contract.
Goodwill and Indefinite-Life Intangible Assets
We test goodwill and indefinite-life intangible assets for impairment on an annual basis on July 1. We assess goodwill impairment risk throughout the year by performing a qualitative review of entity-specific, industry, market and general economic factors affecting our goodwill reporting units. Annually, we may perform qualitative testing, or depending on factors such as prior year test results, current year developments, current risk evaluations and other practical considerations, we may elect to do quantitative testing instead. In our quantitative testing, we compare a reporting unit’s estimated fair value with its carrying value. We estimate a reporting unit’s fair value using a discounted cash flow method that incorporates planned growth rates, market-based discount rates and estimates of residual value. If the carrying value of a reporting unit’s net assets exceeds its fair value, we would recognize an impairment charge for the amount by which the carrying value exceeds the reporting unit’s fair value.
Annually, we assess indefinite-life intangible assets for impairment by performing a qualitative review and assessing events and circumstances that could affect the fair value or carrying value of these intangible assets. If potential impairment risk exists for a specific asset, we quantitatively test it for impairment by comparing its estimated fair value with its carrying value. During our annual testing, we use several accepted valuation methods, including relief from royalty, excess earnings and excess margin, that utilize estimates of future sales, earnings growth rates, royalty rates and discount rates in determining a brand’s global fair value. If the carrying value of the asset exceeds its fair value, we consider the asset impaired and reduce its carrying value to the estimated fair value.
Business Combinations
The assets acquired and liabilities assumed upon the acquisition or consolidation of a business are recorded at fair value, with the residual of the purchase price allocated to goodwill. During the measurement period, which may be up to one year from the acquisition date, we may record adjustments to assets acquired and liabilities assumed with the corresponding offset to goodwill. The results of operations of an acquired business are included in our operating results from the date of acquisition.
Further, certain of our acquisitions may include earn-out provisions or other forms of contingent consideration. As of the acquisition date, we record contingent consideration, as applicable, at the estimated fair value of expected future payments associated with the earn-out. Any changes to the recorded fair value of contingent consideration will be recognized as expenses or earnings in the period in which they occur.
Legal costs, due diligence costs, business valuation costs and all other business acquisition costs are expensed when incurred.
Equity Method Investments
Equity method investments consist of our investments in entities in which we maintain an equity ownership interest and apply the equity method of accounting due to our ability to exert significant influence over decisions relating to their operating and financial affairs. Revenue and expenses of our equity method investees are not consolidated into our financial statements; rather, our proportionate share of the earnings of each investee is reflected as equity method investment net earnings. The carrying values of our equity method investments are also impacted by our proportionate share of items impacting the investee's accumulated other comprehensive income or losses and other items, such as our share of investee dividends.
Insurance and Self-Insurance
We use a combination of insurance and self-insurance for a number of risks, including workers’ compensation, general liability, automobile liability, product liability and our obligation for employee healthcare benefits. We estimate the liabilities associated with these risks on an undiscounted basis by evaluating and making judgments about historical claims experience and other actuarial assumptions and the estimated impact on future results.
Revenue Recognition
We recognize revenue when control over the products transfers to our customers, which generally occurs upon delivery or shipment of the products. We account for product shipping, handling and insurance as fulfillment activities with revenues for these activities recorded within net revenue and costs recorded within cost of sales. Any taxes collected on behalf of government authorities are excluded from net revenues.
76 | | |||||||
Revenues are recorded net of trade and sales incentives and estimated product returns. Known or expected pricing or revenue adjustments, such as trade discounts, rebates or returns, are estimated at the time of sale. We base these estimates of expected amounts principally on historical utilization and redemption rates. Estimates that affect revenue, such as trade incentives and product returns, are monitored and adjusted each period until the incentives or product returns are realized.
Key sales terms, such as pricing and quantities ordered, are established on a frequent basis such that most customer arrangements and related incentives have a one year or shorter duration. As such, we do not capitalize contract inception costs and we capitalize product fulfillment costs. Deferred revenues are not material and primarily include customer advance payments typically collected a few days before product delivery, at which time deferred revenues are reclassified and recorded as net revenues. We generally do not receive non-cash consideration for the sale of goods nor do we grant payment financing terms greater than one year.
Marketing, Advertising and Research and Development
Stock-based Compensation
We maintain a share-based compensation plan, which authorizes the granting of various equity-based incentives, including stock options (including stock appreciation rights), deferred stock units (DSUs) and performance share units (PSUs). Stock compensation expense is amortized to expense over the vesting period, generally three years .
Stock options are granted with an exercise price equal to the closing market price of our Common Stock on the grant date. Substantially all of the options become exercisable in three annual installments beginning a year from the grant date and generally expire 10 years from the grant date. We use the Black-Scholes Model to measure the fair value of stock options granted to employees. The expected life of the options represents the period of time the options are expected to be outstanding and is based on historical trends. Expected stock price volatility is based on the implied and historical volatility of the Company’s stock. The expected dividend yield is based on the Company’s most recent annual dividend rate. The risk-free interest rate is based on the U.S. Treasury yield curve in effect at the time of grant with a term equal to the expected life.
DSUs are typically granted to selected management employees on an annual basis and vest over three years . Dividend equivalents are paid during the vesting period for DSUs granted prior to February 27, 2024. For DSUs granted on or after February 27, 2024, dividend equivalents accumulated over the vesting period are paid after vesting. The fair value of our DSUs and other stock-based awards is measured at the market price of our Common Stock on the grant date.
PSUs vest based on varying performance, market and service conditions. Dividend equivalents accumulated over the vesting period are paid after vesting. The grant date fair value of PSUs is determined based on the Monte Carlo simulation model for the market-based component and the market price of our Common Stock on the grant date for performance-based components. The final award may equal 0 -200 percent of the target grant, based on the achievement of the performance and market-based components.
Forfeitures are estimated on the grant date for all of our stock-based compensation awards.
Employee Benefit Plans
We provide a range of benefits to our current and retired employees including pension benefits, defined contribution plan benefits, postretirement health care benefits and postemployment primarily severance-related benefits depending upon local statutory requirements, employee tenure and service requirements as well as other factors. The cost for these plans is recognized in earnings primarily over the working life of the covered employee.
77 | | |||||||
Financial Instruments
We use financial instruments to manage our currency exchange rate, commodity price and interest rate risks. We monitor and manage these exposures as part of our overall risk management program, which focuses on the unpredictability of financial markets and seeks to reduce the potentially adverse effects that the volatility of these markets may have on our operating results. A principal objective of our risk management strategies is to reduce significant, unanticipated earnings fluctuations that may arise from volatility in currency exchange rates, commodity prices and interest rates.
When we use derivatives, we are exposed to credit and market risks. We reduce our credit risk by entering into transactions with counterparties with high quality, investment grade credit ratings, limiting the amount of exposure with each counterparty and monitoring the financial condition of our counterparties. We also maintain a policy of requiring that all significant, non-exchange traded derivative contracts with a duration of one year or longer are governed by an International Swaps and Derivatives Association master agreement. We manage derivative market risk by limiting the types of derivative instruments, derivative strategies we use and the degree of market risk that we plan to hedge through the use of derivative instruments.
We record derivative financial instruments on a gross basis in our consolidated balance sheets. The fair value of our instruments are recorded within other current assets, other assets, other current liabilities and other liabilities in our consolidated balance sheets.
Mark-to-market gains or losses related to our economic hedges are separately presented in the consolidated statements of cash flows within operating activities. Cash flows related to the settlement of derivative instruments designated as hedges of net investments in non-U.S. operations are classified in the consolidated statements of cash flows within investing activities. Cash flows related to derivative instruments that are designated or settled economic hedges are classified in the same line item as the cash flows of the related hedged item. Cash flows related to the settlement of all other free-standing derivative instruments are classified within investing activities.
Commodity derivatives. We are exposed to price risk related to forecasted purchases of certain commodities that we primarily use as raw materials. We enter into commodity forward, futures, option and swap contracts. Commodity forward contracts generally are not subject to the accounting requirements for derivative instruments and hedging activities under the normal purchases exception. We sell commodity futures to hedge future purchase commitments. We occasionally use related futures to cross-hedge a commodity exposure. We are not a party to leveraged derivatives and do not use financial instruments for speculative purposes. Any mark-to-market gains or losses are recorded in earnings (see Note 10, Financial Instruments, for additional information).
Currency exchange derivatives. We enter into currency exchange forward, futures, option and swap contracts to mitigate our exposure to changes in exchange rates from third-party and intercompany current and forecasted transactions. Any mark-to-market gains or losses are recorded in earnings (see Note 10, Financial Instruments, for additional information).
Interest rate cash flow hedges. We manage interest rate volatility by modifying the pricing or maturity characteristics of certain liabilities so that the net impact on expense is not, on a material basis, adversely affected by movements in interest rates. We use derivative instruments, including interest rate swaps that have indices related to the pricing of specific liabilities as part of our interest rate risk management strategy. We use cross-currency interest rate swaps to hedge interest payments on newly issued debt denominated in a different currency than the functional currency of the borrowing entity. Substantially all of these derivative instruments are highly effective and qualify for hedge accounting treatment. Changes in the fair value of derivatives that are designated as a cash flow hedge, to the extent the hedge is effective, are recorded in accumulated other comprehensive earnings/(losses), net of deferred taxes, and reclassified to earnings when the hedged item affects earnings (see Note 10, Financial Instruments, for additional information).
Hedges of net investments in non-U.S. operations. We have numerous investments outside the United States. The net assets of these subsidiaries are exposed to changes and volatility in currency exchange rates. We use local currency denominated debt to hedge our non-U.S. net investments against adverse movements in exchange rates. We may designate non-U.S. dollar-denominated borrowings in the U.S. as a net investment hedge of a portion of our overall non-U.S. operations. The gains and losses on our net investment in these designated non-U.S. operations are economically offset by losses and gains designated dollar-denominated borrowings. The revaluation of designated borrowings, net of deferred taxes, is recorded within currency translation adjustment in accumulated other comprehensive earnings/(losses) (see Note 10, Financial Instruments, for additional information).
78 | | |||||||
We use derivatives instruments to hedge certain investments in our non-U.S. operations against movements in exchange rates. These instruments may include cross-currency interest rate swaps, forwards and options. The after-tax gain/(loss) on these net investment hedge contracts, net of deferred taxes, is recorded within cumulative translation adjustment in accumulated other comprehensive earnings/(losses) (see Note 10, Financial Instruments, for additional information).
Income Taxes
Our provision for income taxes includes amounts payable or refundable for the current year, the effects of deferred taxes and impacts from uncertain tax positions. We recognize deferred tax assets and liabilities for the expected future tax consequences of temporary differences between the financial statement and tax basis of our assets and liabilities, operating loss carryforwards and tax credit carryforwards. Deferred tax assets and liabilities are measured using enacted tax rates expected to apply in the years in which those differences are expected to reverse.
The realization of certain deferred tax assets is dependent on generating sufficient taxable income in the appropriate jurisdiction prior to the expiration of the carryforward periods. Deferred tax assets are reduced by a valuation allowance if it is more likely than not that some portion, or all, of the deferred tax assets will not be realized. When assessing the need for a valuation allowance, we consider any carryback potential, future reversals of existing taxable temporary differences (including liabilities for unrecognized tax benefits), future taxable income and tax planning strategies.
We recognize tax benefits in our financial statements from uncertain tax positions only if it is more likely than not that the tax position will be sustained based on the technical merits of the position. The amount we recognize is measured as the largest amount of benefit that is greater than 50 percent likely of being realized upon resolution. Future changes related to the expected resolution of uncertain tax positions could affect tax expense in the period when the change occurs.
We monitor for changes in tax laws and reflect the impacts of tax law changes in the period of enactment. When there is refinement to tax law changes in subsequent periods, we account for the new guidance in the period when it becomes known.
Supply Chain Financing
The roll-forward of our outstanding obligations confirmed as valid under our SCF program are as follows:
For the Year Ended December 31, | |||||
2024 | |||||
(in millions) | |||||
Confirmed obligations outstanding at the beginning of the year | $ | ||||
| New invoices confirmed during the year | |||||
| Confirmed invoices paid during the year | ( | ||||
| Currency | ( | ||||
Confirmed obligations outstanding at the end of the year | $ | ||||
79 | | |||||||
New Accounting Pronouncements
In September 2022, the FASB issued an ASU which enhances the transparency of supplier finance programs by requiring additional disclosure about the key terms of these programs and a roll-forward of the related obligations to understand the effects of these programs on working capital, liquidity and cash flows. The ASU is effective for fiscal years beginning after December 15, 2022, except for the roll-forward requirement, which is effective for fiscal years beginning after December 15, 2023. Early adoption is permitted. We adopted, with the exception of the roll-forward requirement in the first quarter of 2023 and the subsequent roll-forward requirement on a prospective basis in the fourth quarter of 2024. This adoption did not have a material impact on our consolidated financial statements and related disclosures.
In November 2023, the FASB issued an ASU which improves reportable segment disclosure requirements, primarily through enhanced disclosures about significant segment expenses. The ASU is effective for fiscal years beginning after December 15, 2023 and early adoption is permitted. We adopted this standard, retrospectively to all comparative periods, in the fourth quarter of 2024 and it did not have a material impact on our consolidated financial statements and related segment disclosures.
In December 2023, the FASB issued an ASU which enhances the transparency of income tax disclosures, primarily related to the rate reconciliation and income taxes paid information. The ASU is effective for fiscal years beginning after December 15, 2024 and early adoption is permitted. We are currently assessing the impact on our consolidated financial statements and related disclosures.
In November 2024, the FASB issued an ASU which requires incremental disclosures in the notes to the financial statements to disaggregate certain income statement expense line items. The ASU is effective for fiscal years beginning after December 15, 2026 and early adoption is permitted. We are currently assessing the impact on our consolidated financial statements and related disclosures.
80 | | |||||||
Note 2. Acquisitions and Divestitures
Acquisitions
Evirth
On November 1, 2024, we acquired Evirth (Shanghai) Industrial Co., Ltd. (“Evirth”), a leading manufacturer of cakes and pastries in China. The acquisition will continue to expand our growth in the cakes and pastries categories. The cash consideration paid for Evirth totaled ¥1.7 billion ($240 million), net of cash received.
We are working to complete the valuation of assets acquired and liabilities assumed and have recorded a preliminary purchase price allocation as of December 31, 2024.
Within definite-lived intangible assets, we allocated $117 million to customer relationships which have an estimated useful life of 17 years. The fair value of customer relationships at the acquisition date was determined using the multi-period excess earnings method under the income approach. The fair value measurements are based on significant unobservable inputs, and thus represent Level 3 inputs. Significant assumptions used in assessing the fair values of the intangible assets include discounted cash flows, customer attrition rates and discount rates.
Goodwill of $122 million was determined as the excess of the purchase price over the fair value of the net assets acquired and arises principally as a result of expansion opportunities and synergies across China. None of the goodwill recognized will be deductible for income tax purposes. All of the goodwill was assigned to the AMEA operating segment. For further detail, refer to Note 6. Goodwill and Intangible Assets.
We incurred acquisition integration and contingent consideration adjustment costs of $8 million, acquisition-related costs of $3 million and an inventory step-up charge of $3 million in 2024.
Ricolino
On November 1, 2022, we acquired100 % of the equity of Grupo Bimbo's confectionery business, Ricolino, located primarily in Mexico. The acquisition of Ricolino builds on our continued prioritization of fast-growing snacking segments in key geographies. The cash consideration paid for Ricolino totaled 26 billion Mexican pesos ($1.3 billion), net of cash received.
On November 1, 2022, we acquired
We incurred acquisition integration costs of $21 million in 2024, $50 million in 2023 and $11 million in 2022. In 2022, we also incurred an inventory step-up charge of $5 million and recorded several items within acquisition-related costs that resulted in income of $64 million as realized gains related to hedging contracts associated with acquisition funds more than offset other acquisition transaction costs.
Clif Bar
On August 1, 2022, we acquired 100 % of the equity of Clif Bar & Company (“Clif Bar”), a leading U.S. maker of nutritious energy bars with organic ingredients. The acquisition expands our global snack bar business and complements our refrigerated snacking and performance nutrition bar portfolios. The total cash payment of $2.9 billion includes purchase price consideration of $2.6 billion, net of cash received, and one-time compensation expense of $0.3 billion related to the buyout of the non-vested employee stock ownership plan ("ESOP") shares. This compensation expense is considered an acquisition-related cost. We also incurred a contingent consideration liability with an acquisition date fair value of $440 million.
We recorded a net gain in acquisition integration costs and contingent consideration adjustments of $393 million in 2024 and incurred acquisition integration costs and contingent consideration adjustments of $164 million in 2023 and $30 million in 2022. Refer to Note 10, Financial Instruments for additional information on the changes to the contingent consideration liability. We also incurred acquisition-related costs of $296 million, primarily related to the buyout of the non-vested ESOP shares, and an inventory step-up charge of $20 million in 2022.
Chipita
On January 3, 2022, we acquired 100 % of the equity of Chipita Global S.A. (“Chipita”), a leading croissants and baked snacks company in the Central and Eastern European markets. The acquisition of Chipita offers a strategic complement to our existing portfolio and advances our strategy to become the global leader in broader snacking. The cash consideration paid for Chipita totaled €1.2 billion ($1.4 billion), net of cash received, plus the assumption of Chipita’s debt of €0.4 billion ($0.4 billion) for a total purchase price of €1.7 billion ($1.8 billion).
81 | | |||||||
We incurred acquisition integration costs of $20 million in 2024, $17 million in 2023 and $90 million in 2022. We incurred acquisition-related costs of $22 million in 2022.
Divestitures
Developed Market Gum
On October 1, 2023, we completed the sale of our developed market gum business in the United States, Canada and Europe to Perfetti Van Melle Group, excluding the Portugal business which we retained pending regulatory approval. After obtaining the regulatory approval, we completed the sale of the Portugal business to Perfetti Van Melle Group on October 23, 2023. We received cash proceeds of $1.4 billion. We recorded a of $108 million on the sale. We recorded divestiture-related costs of $1 million in 2024, $83 million in 2023 and $15 million in 2022.
This disposition was not considered a strategic shift that would have a major effect on our operations or financial results; therefore, the results of the disposed business were not classified as discontinued operations.
Note 3. Inventories
Inventories consisted of the following:
| As of December 31, | |||||||||||
| 2024 | 2023 | ||||||||||
| (in millions) | |||||||||||
| Raw materials | $ | $ | |||||||||
| Finished product | |||||||||||
| Inventory reserves | ( | ( | |||||||||
| Inventories, net | $ | $ | |||||||||
Note 4. Property, Plant and Equipment
Property, plant and equipment consisted of the following:
| As of December 31, | |||||||||||
| 2024 | 2023 | ||||||||||
| (in millions) | |||||||||||
| Land and land improvements | $ | $ | |||||||||
| Buildings and building improvements | |||||||||||
| Machinery and equipment | |||||||||||
| Construction in progress | |||||||||||
| Accumulated depreciation | ( | ( | |||||||||
| Property, plant and equipment, net | $ | $ | |||||||||
Capital expenditures as presented on the statement of cash flow were approximately $1.4 billion, $1.1 billion and $0.9 billion for the years ending December 31, 2024, 2023 and 2022, respectively, and excluded $458 million, $471 million and $324 million, respectively, for accrued capital expenditures not yet paid.
82 | | |||||||
Note 5. Leases
We have operating and finance leases for manufacturing and distribution facilities, vehicles, equipment and office space. Our leases generally have remaining lease terms of 1 to 15 years, some of which include options to extend the leases for up to 10 years.
The components of lease costs were as follows:
| For the Years Ended December 31, | |||||||||||||||||
| 2024 | 2023 | 2022 | |||||||||||||||
| (in millions) | |||||||||||||||||
| Operating lease cost | $ | $ | $ | ||||||||||||||
| Finance lease cost: | |||||||||||||||||
Amortization of ROU assets | |||||||||||||||||
| Interest on lease liabilities | |||||||||||||||||
| Short-term lease cost | |||||||||||||||||
| Variable lease cost | |||||||||||||||||
| Sublease income | ( | ( | ( | ||||||||||||||
| Total lease cost | $ | $ | $ | ||||||||||||||
Supplemental cash flow information related to leases was as follows:
| For the Years Ended December 31, | |||||||||||||||||
| 2024 | 2023 | 2022 | |||||||||||||||
| (in millions) | |||||||||||||||||
| Cash paid for amounts included in the measurement of lease liabilities: | |||||||||||||||||
| Operating cash flows from operating leases | $ | ( | $ | ( | $ | ( | |||||||||||
| Operating cash flows from finance leases | ( | ( | ( | ||||||||||||||
| Financing cash flows from finance leases | ( | ( | ( | ||||||||||||||
ROU assets obtained in exchange for lease obligations: | |||||||||||||||||
| Operating leases | $ | $ | $ | ||||||||||||||
| Finance leases | |||||||||||||||||
83 | | |||||||
Supplemental balance sheet information related to leases was as follows:
| As of December 31, | |||||||||||
| 2024 | 2023 | ||||||||||
| (in millions) | |||||||||||
Operating Leases | |||||||||||
Operating lease ROU assets, net of amortization | $ | $ | |||||||||
| $ | $ | ||||||||||
| Long-term operating lease liabilities | |||||||||||
| Total operating lease liabilities | $ | $ | |||||||||
Finance Leases | |||||||||||
| $ | $ | ||||||||||
| $ | $ | ||||||||||
| Total finance lease liabilities | $ | $ | |||||||||
| Weighted Average Remaining Lease Term | |||||||||||
| Operating leases | |||||||||||
| Finance leases | |||||||||||
| Weighted Average Discount Rate | |||||||||||
| Operating leases | % | % | |||||||||
| Finance leases | % | % | |||||||||
Maturities of lease liabilities were as follows:
| As of December 31, 2024 | |||||||||||
| Operating Leases | Finance Leases | ||||||||||
| (in millions) | |||||||||||
| Year Ending December 31: | |||||||||||
| 2025 | $ | $ | |||||||||
| 2026 | |||||||||||
| 2027 | |||||||||||
| 2028 | |||||||||||
| 2029 | |||||||||||
| Thereafter | |||||||||||
| Total future undiscounted lease payments | $ | $ | |||||||||
less: imputed interest | ( | ( | |||||||||
| Total reported lease liability | $ | $ | |||||||||
84 | | |||||||
Note 6. Goodwill and Intangible Assets
Goodwill
Changes in goodwill consisted of (in millions):
| Latin America | AMEA | Europe | North America | Total | |||||||||||||||||||||||||
| January 1, 2023 | $ | $ | $ | $ | $ | ||||||||||||||||||||||||
| Currency | ( | ||||||||||||||||||||||||||||
Other (1) | ( | ( | |||||||||||||||||||||||||||
Balance at December 31, 2023 | $ | $ | $ | $ | $ | ||||||||||||||||||||||||
| Currency | ( | ( | ( | ( | ( | ||||||||||||||||||||||||
Acquisition (2) | |||||||||||||||||||||||||||||
Balance at December 31, 2024 | $ | $ | $ | $ | $ | ||||||||||||||||||||||||
(1)Relates to purchase price allocation adjustments for Ricolino and Clif Bar during 2023.
(2)Relates to purchase price allocation for Evirth during 2024. Refer to Note 2, Acquisitions and Divestitures for more information.
Intangible Assets
Intangible assets consisted of the following (in millions):
| As of December 31, 2024 | As of December 31, 2023 | ||||||||||||||||||||||||||||||||||
| Gross carrying amount | Accumulated amortization | Net carrying amount | Gross carrying amount | Accumulated amortization | Net carrying amount | ||||||||||||||||||||||||||||||
Indefinite-life intangible assets (1) | $ | $ | — | $ | $ | $ | — | $ | |||||||||||||||||||||||||||
Definite-life intangible assets | ( | ( | |||||||||||||||||||||||||||||||||
| Total | $ | $ | ( | $ | $ | $ | ( | $ | |||||||||||||||||||||||||||
(1)We recorded intangible asset impairments of $153 million in 2024 and $26 million in 2023 within .
Indefinite-life intangible assets consist principally of brand names purchased through our acquisitions of Nabisco Holdings Corp., the global LU biscuit business of Groupe Danone S.A., Cadbury Limited and Clif Bar. Definite-life intangible assets consist primarily of trademarks, customer-related intangibles, process technology, licenses and non-compete agreements.
Amortization expense for intangible assets was $153 million in 2024, $151 million in 2023 and $132 million in 2022. For the next five years, we estimate annual amortization expense of approximately $135 million in 2025, $110 million in 2026, $90 million in 2027 and $85
In 2024, 2023 and 2022, there were no
In 2024, we recorded $153 million of intangible asset impairment charges related to two biscuit brands in the Europe segment, one biscuit brand in the AMEA segment and one candy and one biscuit brand in the Latin America segment. We identified thirteen brands, as part of our annual test, that each had a fair value in excess of book value of 10% or less. The aggregate value of the thirteen brands was $2.9 billion as of December 31, 2024. We believe our current plans for each of these brands will allow them to not be impaired, but if plans to grow brand revenue and earnings, and expand margin are not met or specific valuation factors outside of our control, such as discount rates, change significantly, then a brand or brands could become impaired in the future.
In 2023, we recorded $26 million of intangible asset impairment charges related to a chocolate brand in North America and a biscuit brand in Europe. In 2022, we recorded $101 million of intangible asset impairment charges related to two biscuit brands in AMEA.
85 | | |||||||
Note 7. Investments
Equity Method Investments
Our equity method investments include, but are not limited to, our ownership interests in Dong Suh Foods Corporation and Dong Suh Oil & Fats Co. Ltd. Our ownership interests may change over time due to investee stock-based compensation arrangements, share issuances or other equity-related transactions. As of December 31, 2024, we owned 50.0 % and 49.0 %, respectively, of these companies' outstanding shares.
On November 29, 2024, we sold our remaining 85.9 million shares in JDE Peet’s (Euronext Amsterdam: “JDEP”) to JAB Holdings Company. We received €2.2 billion ($2.3 billion) of proceeds at a price of €25.10 per share and recorded a gain on equity method investment transactions of €313 million ($332 million) during 2024. As a result of this transaction, we have fully exited our investment in the company.
Our investments accounted for under the equity method of accounting totaled $0.6 billion as of December 31, 2024 and $3.2 billion as of December 31, 2023. The investment balance as of December 31, 2023 is inclusive of our prior investment in JDEP. We recorded equity earnings and cash dividends of $168 million and $115 million in 2024, equity earnings and cash dividends of $160 million and $137 million in 2023 and equity earnings and cash dividends of $385 million and $184 million in 2022.
Additional JDEP Transactions
In 2024, we determined there was an other-than-temporary impairment for JDEP based on the period of time for which the quoted market price fair value had been less than the carrying value of the investment and the uncertainty surrounding JDEP's stock price recovering to the carrying value. As a result, the investment was written down to its estimated fair value based on the closing price of the underlying equity security of €19.46 per share on March 28, 2024, resulting in an impairment charge of €612 million ($665 million). This charge was included within (Loss)/gain on equity method investment transactions in the consolidated statement of earnings.
In 2023, we sold approximately 9.9 million shares of JDEP, which reduced our ownership interest by 2.0 percentage points, from 19.7 % to 17.7 %. We received cash proceeds of €255 million ($279 million) and recorded a loss of €21 million ($23 million).
In 2022, we sold approximately 18.6 million of our JDEP shares back to JDEP, which reduced our ownership interest by approximately 3.0 percentage points. We received cash proceeds of €500 million ($529 million) and recorded a loss of €8 million ($8 million) on this sale during 2022.
Marketable Securities
During the first quarter of 2023, our ownership in Keurig Dr Pepper Inc. (Nasdaq: "KDP") fell to below 5 % of the outstanding shares, resulting in a change of accounting for our KDP investment, from equity method investment accounting to accounting for equity interests with readily determinable fair values ("marketable securities") as we no longer retained significant influence. Marketable securities are measured at fair value based on quoted prices in active markets for identical assets (Level 1).
Subsequently in 2023, we sold the remainder of our shares of KDP and exited our investment in the company. In total during 2023, we sold approximately 76 million shares and received proceeds of $2.4 billion.
86 | | |||||||
Pre-tax gains for marketable securities are summarized below:
Year Ended December 31, 2023 | |||||
| (in millions) | |||||
Gain on marketable securities sold during the period | $ | ||||
Dividend income and other | |||||
| Total gain on marketable securities | $ | ||||
In the table above, gain on marketable securities sold during the period reflects the difference between the sale proceeds and the carrying value of the equity securities at the date of the change of accounting for our investment in KDP.
Prior to the change of accounting for our KDP investment, we recorded a pre-tax gain on equity method transactions of $493 million ($368 million after-tax) during 2023.
Note 8. Restructuring Program
On May 6, 2014, our Board of Directors approved a $3.5 billion 2014-2018 restructuring program and up to $2.2 billion of capital expenditures. On August 31, 2016, our Board of Directors approved a $600 million reallocation between restructuring program cash costs and capital expenditures so the $5.7 billion program consisted of approximately $4.1 billion of restructuring program costs ($3.1 billion cash costs and $1.0 billion non-cash costs) and up to $1.6 billion of capital expenditures. On September 6, 2018, our Board of Directors approved an extension of the restructuring program through 2022, an increase of $1.3 billion in the program charges and an increase of $700 million in capital expenditures. On October 21, 2021, our Board of Directors approved an extension of the restructuring program through 2023, and on July 25, 2023, our Board of Directors approved a further extension of the restructuring program through December 31, 2024. The total $7.7 billion program consisted of $5.4 billion of program charges ($4.1 billion of cash costs and $1.3 billion of non-cash costs) and total capital expenditures of $2.3 billion incurred over the life of the program. This restructuring program, as increased and extended by these actions, was the Simplify to Grow Program.
The primary objective of the Simplify to Grow Program, which ended on December 31, 2024, was to reduce our operating cost structure in both our supply chain and overhead costs. The program covered severance as well as asset disposals and other manufacturing and procurement-related one-time costs. Since inception, we incurred total restructuring and related implementation charges of $5.4 billion related to the Simplify to Grow Program.
Restructuring Costs
The Simplify to Grow Program liability activity for the years ended December 31, 2024 and 2023 was:
| Severance and related costs | Asset Write-downs and Other (1) | Total | |||||||||||||||
| (in millions) | |||||||||||||||||
| Liability Balance, January 1, 2023 | $ | $ | $ | ||||||||||||||
Charges (2) | |||||||||||||||||
Cash spent (3) | ( | ( | |||||||||||||||
Non-cash items (4) | ( | ( | |||||||||||||||
| Currency | |||||||||||||||||
| Liability Balance, December 31, 2023 | |||||||||||||||||
Charges (2) | |||||||||||||||||
Cash spent (3) | ( | ( | |||||||||||||||
Non-cash items (4) | ( | ( | ( | ||||||||||||||
| Currency | ( | ( | |||||||||||||||
Liability balance, December 31, 2024 (5) | $ | $ | $ | ||||||||||||||
(1)Includes asset write-downs, net of gains on assets sold which were included in the restructuring program.
(2)We recorded restructuring charges of $77 million in 2024, $106 million in 2023 and $36 million in 2022 within asset impairment and exit costs and benefit plan non-service income.
87 | | |||||||
(3)We spent $48 million in 2024 and $67 million in 2023 in cash severance and related costs.
(4)We recognized non-cash asset write-downs (including accelerated depreciation and asset impairments) and other non-cash adjustments, including gains on sales of restructuring program assets, which totaled a charge of $22 million in 2024 and $17 million in 2023.
(5)At December 31, 2024, $115 million of our net restructuring liability was recorded within other current liabilities and $73 million was recorded within other long-term liabilities.
Implementation Costs
Implementation costs are directly attributable to restructuring activities; however, they do not qualify for special accounting treatment as exit or disposal activities. We believe the disclosure of implementation costs provides readers of our financial statements with more information on the total costs of our Simplify to Grow Program. Implementation costs primarily related to reorganizing our operations and facilities in connection with our supply chain reinvention program and other identified productivity and cost saving initiatives. The costs included incremental expenses related to the closure of facilities, costs to terminate certain contracts and the simplification of our information systems. Within our continuing results of operations, we recorded implementation costs of $72 million in 2024, $25 million in 2023 and $87 million in 2022. We recorded these costs within cost of sales and general corporate expense within .
Restructuring and Implementation Costs in Operating Income
During 2024, 2023 and 2022, and since inception of the Simplify to Grow Program, we recorded the following restructuring and implementation costs within segment operating income and earnings before income taxes:
| Latin America | AMEA | Europe | North America | Corporate | Total | ||||||||||||||||||||||||||||||
| (in millions) | |||||||||||||||||||||||||||||||||||
| For the Year Ended December 31, 2024 | |||||||||||||||||||||||||||||||||||
| Restructuring Costs | $ | $ | $ | $ | $ | ( | $ | ||||||||||||||||||||||||||||
| Implementation Costs | |||||||||||||||||||||||||||||||||||
| Total | $ | $ | $ | $ | $ | $ | |||||||||||||||||||||||||||||
| For the Year Ended December 31, 2023 | |||||||||||||||||||||||||||||||||||
| Restructuring Costs | $ | ( | $ | $ | $ | $ | $ | ||||||||||||||||||||||||||||
| Implementation Costs | |||||||||||||||||||||||||||||||||||
| Total | $ | ( | $ | $ | $ | $ | $ | ||||||||||||||||||||||||||||
| For the Year Ended December 31, 2022 | |||||||||||||||||||||||||||||||||||
| Restructuring Costs | $ | ( | $ | $ | $ | $ | $ | ||||||||||||||||||||||||||||
| Implementation Costs | |||||||||||||||||||||||||||||||||||
| Total | $ | $ | $ | $ | $ | $ | |||||||||||||||||||||||||||||
| Total Project (Inception to Date) | |||||||||||||||||||||||||||||||||||
| Restructuring Costs | $ | $ | $ | $ | $ | $ | |||||||||||||||||||||||||||||
| Implementation Costs | |||||||||||||||||||||||||||||||||||
| Total | $ | $ | $ | $ | $ | $ | |||||||||||||||||||||||||||||
88 | | |||||||
Note 9. Debt and Borrowing Arrangements
Short-Term Borrowings
Our short-term borrowings and related weighted-average interest rates consisted of:
| As of December 31, | |||||||||||||||||||||||
| 2024 | 2023 | ||||||||||||||||||||||
| Amount Outstanding | Weighted- Average Rate | Amount Outstanding | Weighted- Average Rate | ||||||||||||||||||||
| (in millions) | (in millions) | ||||||||||||||||||||||
| Commercial paper | $ | % | $ | % | |||||||||||||||||||
| Bank loans | % | % | |||||||||||||||||||||
| Total short-term borrowings | $ | $ | |||||||||||||||||||||
Our uncommitted credit lines and committed credit lines available include:
| As of December 31, | |||||||||||||||||||||||
| 2024 | 2023 | ||||||||||||||||||||||
| Facility Amount | Borrowed Amount | Facility Amount | Borrowed Amount | ||||||||||||||||||||
| (in millions) | |||||||||||||||||||||||
Uncommitted credit facilities (1) | $ | $ | $ | $ | |||||||||||||||||||
Credit facilities: | |||||||||||||||||||||||
February 21, 2024 (2) | |||||||||||||||||||||||
February 19, 2025 (2) | |||||||||||||||||||||||
February 23, 2027 (2) | |||||||||||||||||||||||
Various (3) | |||||||||||||||||||||||
(1)Prior year facility amount has been revised.
(2)We maintain senior unsecured revolving credit facilities for general corporate purposes, including working capital needs, and to support our commercial paper program. The revolving credit agreements include a covenant that we maintain a minimum shareholders' equity of at least $25.0 billion, excluding accumulated other comprehensive earnings/(losses), the cumulative effects of any changes in accounting principles and earnings/(losses) recognized in connection with the ongoing application of any mark-to-market accounting for pensions and other retirement plans. At December 31, 2024, we complied with this covenant as our shareholders' equity, as defined by the covenant, was $39.4 billion. The revolving credit facility also contains customary representations, covenants and events of default. There are no credit rating triggers, provisions or other financial covenants that could require us to post collateral as security.
(3)On April 18, 2023, and subsequently amended on October 3, 2023 and April 4, 2024, we entered into a credit facility secured by pledged deposits classified as long-term other assets. Draw downs on the facility bore a variable rate based on SOFR plus applicable margin. On August 13, 2024, we repaid all amounts borrowed and terminated this credit facility .
During 2023, we repaid $2.0 billion in term loans related to 2022 credit facility borrowings.
89 | | |||||||
Long-Term Debt
Our long-term debt consisted of (interest rates are as of December 31, 2024):
| As of December 31, | |||||||||||
2024 (1) | 2023 | ||||||||||
| (in millions) | |||||||||||
U.S. dollar notes and term loans, | $ | $ | |||||||||
Euro notes, due through 2041 | |||||||||||
Pound sterling notes, due through 2045 | |||||||||||
Swiss franc notes, due through 2025 | |||||||||||
Canadian dollar notes, due through 2030 | |||||||||||
| Finance leases and other | |||||||||||
| Total | |||||||||||
less: current portion of long-term debt | ( | ( | |||||||||
| Long-term debt | $ | $ | |||||||||
(1) Amounts are shown net of un amortized premiums, discounts and bank fees of $(119 ) million and imputed interest on finance leases of $(28 ) million.
Over the next five years, aggregate principal maturities, including finance leases, of our long-term debt are (in millions):
| 2025 | 2026 | 2027 | 2028 | 2029 | Thereafter | Total | ||||||||||||||||||||||||||||||||
| $ | $ | $ | $ | $ | $ | $ | ||||||||||||||||||||||||||||||||
Debt Repayments
During 2024, we repaid the following notes (in millions):
| Interest Rate | Maturity Date | Amount | USD Equivalent | |||||||||||||||||
| March 2024 | $ | $ | ||||||||||||||||||
September 2024 (1) | $ | $ | ||||||||||||||||||
September 2024 (1) (2) | € | $ | ||||||||||||||||||
September 2024 (1) | $ | $ | ||||||||||||||||||
| September 2024 | Fr. | $ | ||||||||||||||||||
(1)Repaid by Mondelez International Holdings Netherlands B.V. ("MIHN"), a wholly owned Dutch subsidiary of Mondelēz International, Inc.
(2)Repayment of €300 million exchangeable bonds. Refer to Note 10, Financial Instruments for additional detail on these exchangeable bonds.
During 2023, we repaid the following notes (in millions):
| Interest Rate | Maturity Date | Amount | USD Equivalent | |||||||||||||||||
| December 2023 | Fr. | $ | ||||||||||||||||||
90 | | |||||||
Debt Issuances
During 2024, we issued the following notes (in millions):
| Issuance Date | Interest Rate | Maturity Date | Gross Proceeds (1) | Gross Proceeds USD Equivalent | ||||||||||||||||||||||
| February 2024 | February 2029 | $ | $ | |||||||||||||||||||||||
| July 2024 | July 2031 | C$ | $ | |||||||||||||||||||||||
| August 2024 | August 2034 | $ | $ | |||||||||||||||||||||||
(1)Represents gross proceeds from the issuance of notes excluding debt issuance costs, discounts and premiums.
During 2023, we did no t complete any debt issuances.
Fair Value of Our Debt
The fair value of our short-term borrowings reflects current market interest rates and approximates the amounts we have recorded on our consolidated balance sheets. The fair value of our long-term debt was determined using quoted prices in active markets (Level 1 valuation data) for the publicly traded debt obligations.
| As of December 31, | |||||||||||
| 2024 | 2023 | ||||||||||
| (in millions) | |||||||||||
| Fair Value | $ | $ | |||||||||
| Carrying Value | |||||||||||
Interest and Other Expense, net
Interest and other expense, net within our results of continuing operations consisted of:
| For the Years Ended December 31, | |||||||||||||||||
| 2024 | 2023 | 2022 | |||||||||||||||
| (in millions) | |||||||||||||||||
| Interest expense, debt | $ | $ | $ | ||||||||||||||
| Loss on debt extinguishment and related expenses | |||||||||||||||||
| Other income, net | ( | ( | ( | ||||||||||||||
| Interest and other expense, net | $ | $ | $ | ||||||||||||||
Other income, net includes amounts excluded from the assessment of hedge effectiveness related to our net investment hedge derivative contracts and movement in foreign currency exchange rates on certain foreign currency denominated assets and liabilities, related economic hedges and other items. Refer to Note 10, Financial Instruments.
91 | | |||||||
Note 10. Financial Instruments
Fair Value of Derivative Instruments
Derivative instruments were recorded at fair value in the consolidated balance sheets as follows:
| As of December 31, | |||||||||||||||||||||||
| 2024 | 2023 | ||||||||||||||||||||||
| Asset Derivatives | Liability Derivatives | Asset Derivatives | Liability Derivatives | ||||||||||||||||||||
| (in millions) | |||||||||||||||||||||||
Derivatives designated as accounting hedges: | |||||||||||||||||||||||
| Interest rate contracts | $ | $ | $ | $ | |||||||||||||||||||
Net investment hedge derivative contracts (1) | |||||||||||||||||||||||
| Derivatives not designated as accounting hedges: | |||||||||||||||||||||||
| Currency exchange contracts | $ | $ | $ | $ | |||||||||||||||||||
| Commodity contracts | |||||||||||||||||||||||
| Interest rate contracts | |||||||||||||||||||||||
| Total fair value | $ | $ | $ | $ | |||||||||||||||||||
(1)Net investment hedge derivative contracts consist of cross-currency interest rate swaps, forward contracts and options. We also designate some of our non-U.S. dollar denominated debt to hedge a portion of our net investments in our non-U.S. operations. This debt is not reflected in the table above, but is included in long-term debt discussed in Note 9, Debt and Borrowing Arrangements. Both net investment hedge derivative contracts and non-U.S. dollar denominated debt acting as net investment hedges are also disclosed in the Derivative Volume table and the Hedges of Net Investments in International Operations section appearing later in this footnote.
We recorded the fair value of our derivative instruments in the consolidated balance sheet as follows:
| As of December 31, | |||||||||||
| 2024 | 2023 | ||||||||||
| (in millions) | |||||||||||
Other current assets | $ | $ | |||||||||
Other assets | |||||||||||
Other current liabilities | |||||||||||
Other liabilities | |||||||||||
92 | | |||||||
The fair values (asset/(liability)) of our derivative instruments were determined using:
| As of December 31, 2024 | |||||||||||||||||||||||
| Total Fair Value of Net Asset/(Liability) | Quoted Prices in Active Markets for Identical Assets (Level 1) | Significant Other Observable Inputs (Level 2) | Significant Unobservable Inputs (Level 3) | ||||||||||||||||||||
| (in millions) | |||||||||||||||||||||||
| Currency exchange contracts | $ | $ | $ | $ | |||||||||||||||||||
| Commodity contracts | ( | ||||||||||||||||||||||
| Interest rate contracts | |||||||||||||||||||||||
| Net investment hedge contracts | |||||||||||||||||||||||
| Total derivatives | $ | $ | ( | $ | $ | ||||||||||||||||||
| As of December 31, 2023 | |||||||||||||||||||||||
| Total Fair Value of Net Asset/(Liability) | Quoted Prices in Active Markets for Identical Assets (Level 1) | Significant Other Observable Inputs (Level 2) | Significant Unobservable Inputs (Level 3) | ||||||||||||||||||||
| (in millions) | |||||||||||||||||||||||
| Currency exchange contracts | $ | $ | $ | $ | |||||||||||||||||||
| Commodity contracts | |||||||||||||||||||||||
| Interest rate contracts | |||||||||||||||||||||||
| Net investment hedge contracts | ( | ( | |||||||||||||||||||||
| Total derivatives | $ | $ | $ | $ | |||||||||||||||||||
Level 1 financial assets and liabilities consist of exchange-traded commodity futures and listed options. The fair value of these instruments is determined based on quoted market prices on commodity exchanges.
Level 2 financial assets and liabilities consist primarily of over-the-counter (“OTC”) currency exchange forwards, options and swaps; commodity forwards and options; net investment hedge contracts; and interest rate swaps. Our currency exchange contracts are valued using an income approach based on observable market forward rates less the contract rate multiplied by the notional amount. Commodity derivatives are valued using an income approach based on the observable market commodity index prices less the contract rate multiplied by the notional amount or based on pricing models that rely on market observable inputs such as commodity prices. Our calculation of the fair value of interest rate swaps is derived from a discounted cash flow analysis based on the terms of the contract and the observable market interest rate curve. Our calculation of the fair value of financial instruments takes into consideration the risk of nonperformance, including counterparty credit risk. Our OTC derivative transactions are governed by International Swap Dealers Association agreements and other standard industry contracts. Under these agreements, we do not post nor require collateral from our counterparties. The majority of our derivative contracts do not have a legal right of set-off. We manage the credit risk in connection with these and all our derivatives by entering into transactions with counterparties with investment grade credit ratings, limiting the amount of exposure with each counterparty and monitoring the financial condition of our counterparties.
93 | | |||||||
Derivative Volume
The gross notional values of our derivative instruments were:
| Notional Amount | |||||||||||
| As of December 31, | |||||||||||
| 2024 | 2023 | ||||||||||
| (in millions) | |||||||||||
| Currency exchange contracts: | |||||||||||
Intercompany loans and forecasted interest payments | $ | $ | |||||||||
Forecasted transactions | |||||||||||
Commodity contracts | |||||||||||
| Interest rate contracts | |||||||||||
| Net investment hedges: | |||||||||||
| Net investment hedge derivative contracts | |||||||||||
Non-U.S. dollar debt designated as net investment hedges: | |||||||||||
Euro notes | |||||||||||
Swiss franc notes | |||||||||||
Canadian dollar notes | |||||||||||
Cash Flow Hedges
Cash flow hedge activity, net of taxes, is recorded within accumulated other comprehensive earnings/(losses). Refer to Note 15, Reclassifications from Accumulated Other Comprehensive Income for further information on current period activity. Based on current market conditions, we would expect to transfer losses of $31 million (net of taxes) for interest rate cash flow hedges to earnings during the next 12 months.
Cash Flow Hedge Coverage
As of December 31, 2024, our longest dated cash flow hedges were interest rate swaps that hedge forecasted interest rate payments over the next 4 years.
Hedges of Net Investments in International Operations
Net investment hedge (“NIH”) derivative contracts
We enter into cross-currency interest rate swaps, forwards and options to hedge certain investments in our non-U.S. operations against movements in exchange rates. As of December 31, 2024, the aggregate notional value of these NIH derivative contracts was $8.6 billion and their impact on other comprehensive earnings and net earnings during the years presented below were as follows:
| For the Years Ended December 31, | |||||||||||||||||
| 2024 | 2023 | 2022 | |||||||||||||||
| (in millions) | |||||||||||||||||
After-tax gain/(loss) on NIH contracts (1) | $ | $ | ( | $ | |||||||||||||
(1)Amounts recorded for unsettled and settled NIH derivative contracts are recorded in the cumulative translation adjustment within other comprehensive earnings. The cash flows from the settled contracts are reported within proceeds from derivative settlements and payments for derivative settlements in the consolidated statement of cash flows.
| For the Years Ended December 31, | |||||||||||||||||
| 2024 | 2023 | 2022 | |||||||||||||||
| (in millions) | |||||||||||||||||
Amounts excluded from the assessment of hedge effectiveness (1) | $ | $ | $ | ||||||||||||||
(1)We elected to record changes in the fair value of amounts excluded from the assessment of effectiveness in net earnings within interest and other expense, net.
94 | | |||||||
Non-U.S. dollar debt designated as net investment hedges
After-tax gains/(losses) related to hedges of net investments in international operations were recorded within the cumulative translation adjustment section of other comprehensive income and were:
| For the Years Ended December 31, | |||||||||||||||||
| 2024 | 2023 | 2022 | |||||||||||||||
| (in millions) | |||||||||||||||||
| Euro notes | $ | $ | ( | $ | |||||||||||||
| British pound sterling notes | |||||||||||||||||
| Swiss franc notes | ( | ||||||||||||||||
| Canadian notes | ( | ||||||||||||||||
Economic Hedges
Pre-tax gains/(losses) recorded in net earnings for economic hedges were:
| For the Years Ended December 31, | Recognized in Earnings | ||||||||||||||||||||||
| 2024 | 2023 | 2022 | |||||||||||||||||||||
| (in millions) | |||||||||||||||||||||||
| Currency exchange contracts: | |||||||||||||||||||||||
| Intercompany loans and forecasted interest payments | $ | $ | $ | ( | Interest and other expense, net | ||||||||||||||||||
| Forecasted transactions | Cost of sales | ||||||||||||||||||||||
| Forecasted transactions | Interest and other expense, net | ||||||||||||||||||||||
| Forecasted transactions | ( | ( | Selling, general and administrative expenses | ||||||||||||||||||||
| Commodity contracts | Cost of sales | ||||||||||||||||||||||
Equity method investment contracts (1) | Gain on equity method investment contracts | ||||||||||||||||||||||
| Total | $ | $ | $ | ||||||||||||||||||||
(1) Equity method investment contracts consisted of the bifurcated embedded derivative option that were a component of the September 20, 2021 €300 million exchangeable bonds issuance and expired on September 20, 2024. Refer to Note 9, Debt and Borrowing Arrangements for additional information.
95 | | |||||||
Fair Value of Contingent Consideration
The following is a summary of our contingent consideration liability activity:
| For the Years Ended December 31, | |||||||||||||||||
| 2024 | 2023 | 2022 | |||||||||||||||
| (in millions) | |||||||||||||||||
| Liability at the beginning of the period | $ | $ | $ | ||||||||||||||
| Contingent consideration arising from acquisitions | |||||||||||||||||
| Changes in fair value | ( | ||||||||||||||||
Payments | ( | ( | |||||||||||||||
| Currency | ( | ( | |||||||||||||||
| Liability at the end of the period | $ | $ | $ | ||||||||||||||
Contingent consideration was recorded at fair value in the condensed consolidated balance sheets as follows:
| As of December 31, 2024 | |||||||||||||||||||||||
| Total Fair Value of Liability | Quoted Prices in Active Markets for Identical Assets (Level 1) | Significant Other Observable Inputs (Level 2) | Significant Unobservable Inputs (Level 3) | ||||||||||||||||||||
| (in millions) | |||||||||||||||||||||||
Clif Bar (1) | $ | $ | $ | $ | |||||||||||||||||||
Other (2) | |||||||||||||||||||||||
| Total contingent consideration | $ | $ | $ | $ | |||||||||||||||||||
| As of December 31, 2023 | |||||||||||||||||||||||
| Total Fair Value of Liability | Quoted Prices in Active Markets for Identical Assets (Level 1) | Significant Other Observable Inputs (Level 2) | Significant Unobservable Inputs (Level 3) | ||||||||||||||||||||
| (in millions) | |||||||||||||||||||||||
Clif Bar (1) | $ | $ | $ | $ | |||||||||||||||||||
Other (2) | |||||||||||||||||||||||
| Total contingent consideration | $ | $ | $ | $ | |||||||||||||||||||
(1)In connection with the Clif Bar acquisition, we entered into a contingent consideration arrangement that may require us to pay additional consideration to the sellers for achieving certain net revenue, gross profit and EBITDA targets in 2025 and 2026 that exceed our base financial projections for the business implied in the upfront purchase price. The possible payments range from zero to a maximum total of $2.4 billion, with higher payouts requiring the achievement of targets that generate rates of returns in excess of the base financial projections. The contingent consideration liabilities are recorded at fair value within long-term liabilities. The estimated fair value of the contingent consideration obligation is determined using a Monte Carlo simulation. Significant assumptions used in assessing the fair value of the liability include financial projections for net revenue, gross profit, and EBITDA, as well as discount and volatility rates. Fair value adjustments are primarily recorded in selling, general and administrative expenses in the condensed consolidated statement of earnings. During 2024, the expected forecast for 2025 and 2026 was updated to reflect recent trends in business performance and market outlook, resulting in a reduction in the fair value of the contingent consideration.
96 | | |||||||
Note 11. Benefit Plans
Pension Plans
Obligations and Funded Status
The projected benefit obligations, plan assets and funded status of our pension plans were:
| U.S. Plans | Non-U.S. Plans | ||||||||||||||||||||||
| 2024 | 2023 | 2024 | 2023 | ||||||||||||||||||||
| (in millions) | |||||||||||||||||||||||
| Projected benefit obligation at January 1 | $ | $ | $ | $ | |||||||||||||||||||
| Service cost | |||||||||||||||||||||||
| Interest cost | |||||||||||||||||||||||
| Benefits paid | ( | ( | ( | ( | |||||||||||||||||||
| Settlements paid | ( | ( | ( | ||||||||||||||||||||
Actuarial losses/(gains) | ( | ||||||||||||||||||||||
Divestitures | ( | ||||||||||||||||||||||
| Currency | ( | ||||||||||||||||||||||
| Other | |||||||||||||||||||||||
| Projected benefit obligation at December 31 | |||||||||||||||||||||||
| Fair value of plan assets at January 1 | |||||||||||||||||||||||
| Actual return on plan assets | |||||||||||||||||||||||
| Contributions | |||||||||||||||||||||||
| Benefits paid | ( | ( | ( | ( | |||||||||||||||||||
| Settlements paid | ( | ( | ( | ||||||||||||||||||||
Divestitures | ( | ||||||||||||||||||||||
| Currency | ( | ||||||||||||||||||||||
| Other | ( | ||||||||||||||||||||||
| Fair value of plan assets at December 31 | |||||||||||||||||||||||
| Net pension assets at December 31 | $ | $ | $ | $ | |||||||||||||||||||
The accumulated benefit obligation, which represents benefits earned to the measurement date, for U.S. pension plans was $1.2 billion at December 31, 2024 and December 31, 2023. The accumulated benefit obligation for non-U.S. pension plans was $6.6 billion at December 31, 2024 and $7.3 billion at December 31, 2023.
The actuarial (gain)/loss for all pension plans in 2024 and 2023 was primarily related to changes in assumptions including discount rates used to measure the benefit obligations of those plans.
The combined U.S. and non-U.S. pension plans resulted in a net pension asset of $561 million as of December 31, 2024 and a net pension asset of $574 million as of December 31, 2023. We recognized these amounts in our consolidated balance sheets as follows:
| As of December 31, | |||||||||||
| 2024 | 2023 | ||||||||||
| (in millions) | |||||||||||
| Prepaid pension assets | $ | $ | |||||||||
| Other current liabilities | ( | ( | |||||||||
| Accrued pension costs | ( | ( | |||||||||
| $ | $ | ||||||||||
97 | | |||||||
Certain of our U.S. and non-U.S. plans are underfunded with accumulated benefit obligations in excess of plan assets. For these plans, the projected benefit obligations, accumulated benefit obligations and the fair value of plan assets were:
| U.S. Plans | Non-U.S. Plans | ||||||||||||||||||||||
| As of December 31, | As of December 31, | ||||||||||||||||||||||
| 2024 | 2023 | 2024 | 2023 | ||||||||||||||||||||
| (in millions) | |||||||||||||||||||||||
| Projected benefit obligation | $ | $ | $ | $ | |||||||||||||||||||
| Accumulated benefit obligation | |||||||||||||||||||||||
| Fair value of plan assets | |||||||||||||||||||||||
We used the following weighted-average assumptions to determine our benefit obligations under the pension plans:
| U.S. Plans | Non-U.S. Plans | ||||||||||||||||||||||
| As of December 31, | As of December 31, | ||||||||||||||||||||||
| 2024 | 2023 | 2024 | 2023 | ||||||||||||||||||||
| Discount rate | % | % | % | % | |||||||||||||||||||
| Rate of compensation increase | % | % | % | % | |||||||||||||||||||
Year-end discount rates for our U.S., Canadian, Eurozone and U.K. plans were developed from a model portfolio of high quality, fixed-income debt instruments with durations that match the expected future cash flows of the benefit obligations. Year-end discount rates for our remaining non-U.S. plans were developed from local bond indices that match local benefit obligations as closely as possible. Changes in our discount rates were primarily the result of changes in bond yields year-over-year.
For the periods presented, we measure service and interest costs by applying the specific spot rates along a yield curve used to measure plan obligations to the plans’ liability cash flows. We believe this approach provides a more precise measurement of service and interest costs by aligning the timing of the plans’ liability cash flows to the corresponding spot rates on the yield curve.
Mondelēz Global LLC Retirement Plan Update
During the third quarter of 2024, we entered into an agreement with two third party insurance companies for the Mondelēz Global LLC Retirement Plan (“MDLZ Global Plan”), the pension plan for US salaried employees. The agreement features a buy-in of the plan assets with an option to elect a future buy-out conversion. As part of the buy-in, all of the MDLZ Global Plan assets were transferred to the insurance companies in exchange for an annuity contract during the third quarter of 2024 to further reduce the risk of plan asset value volatility. The annuity contract provides all future benefit plan payments to the MDLZ Global Plan participants upon execution of the plan amendment to terminate the plan. However, we continue to retain the primary benefit obligation until the buy-out conversion is completed. Upon election of the buy-out conversion, we will transfer full responsibility of the MDLZ Global Plan obligations to the insurance companies, at which time we will derecognize the assets and liabilities of the pension plan and realize a settlement loss as a component of net periodic pension cost.
The plan amendment to terminate the MDLZ Global Plan was executed on December 31, 2024 and we intend to execute the buy-out conversion in 2025.
98 | | |||||||
Components of Net Periodic Pension Cost
Net periodic pension cost consisted of the following:
| U.S. Plans | Non-U.S. Plans | ||||||||||||||||||||||||||||||||||
| For the Years Ended December 31, | For the Years Ended December 31, | ||||||||||||||||||||||||||||||||||
| 2024 | 2023 | 2022 | 2024 | 2023 | 2022 | ||||||||||||||||||||||||||||||
| (in millions) | |||||||||||||||||||||||||||||||||||
| Service cost | $ | $ | $ | $ | $ | $ | |||||||||||||||||||||||||||||
| Interest cost | |||||||||||||||||||||||||||||||||||
| Expected return on plan assets | ( | ( | ( | ( | ( | ( | |||||||||||||||||||||||||||||
| Amortization: | |||||||||||||||||||||||||||||||||||
Net loss | |||||||||||||||||||||||||||||||||||
| Prior service cost/(benefit) | ( | ( | |||||||||||||||||||||||||||||||||
Curtailment expense/(credit) | ( | ||||||||||||||||||||||||||||||||||
| Settlement losses and other expenses | |||||||||||||||||||||||||||||||||||
Net periodic pension benefit | $ | ( | $ | ( | $ | ( | $ | ( | $ | ( | $ | ( | |||||||||||||||||||||||
We determine our expected rate of return on plan assets from the plan assets’ historical long-term investment performance, current asset allocation and estimates of future long-term returns by asset class. For the U.S. plans, we determine the expected return on plan assets component of net periodic (benefit)/cost using a calculated market-related value of plan assets methodology that averages gains and losses on the plan assets over a four-year period to determine future pension expense. For our non-U.S. plans, we utilize a similar approach with varying cost recognition periods for some plans, and with others, we determine the expected return on plan assets based on asset fair values as of the measurement date.
We used the following weighted-average assumptions to determine our net periodic pension cost:
| U.S. Plans | Non-U.S. Plans | ||||||||||||||||||||||||||||||||||
| For the Years Ended December 31, | For the Years Ended December 31, | ||||||||||||||||||||||||||||||||||
| 2024 | 2023 | 2022 | 2024 | 2023 | 2022 | ||||||||||||||||||||||||||||||
| Discount rate | % | % | % | % | % | % | |||||||||||||||||||||||||||||
| Expected rate of return on plan assets | % | % | % | % | % | % | |||||||||||||||||||||||||||||
| Rate of compensation increase | % | % | % | % | % | % | |||||||||||||||||||||||||||||
99 | | |||||||
Plan Assets
The fair value of pension plan assets was determined using the following fair value measurements:
| As of December 31, 2024 | ||||||||||||||||||||||||||
| Asset Category | Total Fair Value | Quoted Prices in Active Markets for Identical Assets (Level 1) | Significant Other Observable Inputs (Level 2) | Significant Unobservable Inputs (Level 3) | ||||||||||||||||||||||
| (in millions) | ||||||||||||||||||||||||||
| U.S. equity securities | $ | $ | $ | $ | ||||||||||||||||||||||
| Pooled funds - equity securities | ||||||||||||||||||||||||||
| Total equity securities | ||||||||||||||||||||||||||
| Government bonds | ||||||||||||||||||||||||||
| Pooled funds - fixed-income securities | ||||||||||||||||||||||||||
Corporate bonds and fixed-income securities | ||||||||||||||||||||||||||
Buy-in annuity contracts and other | ||||||||||||||||||||||||||
| Total fixed-income securities | ||||||||||||||||||||||||||
| Real estate | ||||||||||||||||||||||||||
| Private equity | ||||||||||||||||||||||||||
Cash and other | ||||||||||||||||||||||||||
| Total assets in the fair value hierarchy | $ | $ | $ | $ | ||||||||||||||||||||||
| Investments measured at net asset value | ||||||||||||||||||||||||||
| Total investments at fair value | $ | |||||||||||||||||||||||||
| As of December 31, 2023 | ||||||||||||||||||||||||||
| Asset Category | Total Fair Value | Quoted Prices in Active Markets for Identical Assets (Level 1) | Significant Other Observable Inputs (Level 2) | Significant Unobservable Inputs (Level 3) | ||||||||||||||||||||||
| (in millions) | ||||||||||||||||||||||||||
| U.S. equity securities | $ | $ | $ | $ | ||||||||||||||||||||||
| Pooled funds - equity securities | ||||||||||||||||||||||||||
| Total equity securities | ||||||||||||||||||||||||||
| Government bonds | ||||||||||||||||||||||||||
| Pooled funds - fixed-income securities | ||||||||||||||||||||||||||
Corporate bonds and fixed-income securities | ||||||||||||||||||||||||||
Buy-in annuity contracts and other | ||||||||||||||||||||||||||
| Total fixed-income securities | ||||||||||||||||||||||||||
| Real estate | ||||||||||||||||||||||||||
| Private equity | ||||||||||||||||||||||||||
Cash and other | ||||||||||||||||||||||||||
| Total assets in the fair value hierarchy | $ | $ | $ | $ | ||||||||||||||||||||||
| Investments measured at net asset value | ||||||||||||||||||||||||||
| Total investments at fair value | $ | |||||||||||||||||||||||||
We excluded plan assets of $96 million at December 31, 2024 and $97 million at December 31, 2023 from the above tables related to certain insurance contracts as they are reported at contract value, in accordance with authoritative guidance.
100 | | |||||||
Fair value measurements
•Level 1 – includes primarily U.S and non-U.S. equity securities and government bonds valued using quoted prices in active markets.
•Level 2 – includes primarily pooled funds, including assets in real estate pooled funds, valued using net asset values of participation units held in common collective trusts, as reported by the managers of the trusts and as supported by the unit prices of actual purchase and sale transactions. Level 2 plan assets also include corporate bonds and other fixed-income securities, valued using independent observable market inputs, such as matrix pricing, yield curves and indices.
•Level 3 – includes investments valued using unobservable inputs that reflect the plans’ assumptions that market participants would use in pricing the assets, based on the best information available.
•Fair value estimates for pooled funds are calculated by the investment advisor when reliable quotations or pricing services are not readily available for certain underlying securities. The estimated value is based on either cost or last sale price for most of the securities valued in this fashion.
•Fair value estimates for private equity investments are calculated by the general partners using the market approach to estimate the fair value of private investments. The market approach utilizes prices and other relevant information generated by market transactions, type of security, degree of liquidity, restrictions on the disposition, latest round of financing data, company financial statements, relevant valuation multiples and discounted cash flow analyses.
•Fair value estimates for private debt placements are calculated using standardized valuation methods, including income-based techniques such as discounted cash flow projections or market-based techniques utilizing public and private transaction multiples as comparables.
•Fair value estimates for real estate investments are calculated by investment managers using the present value of future cash flows expected to be received from the investments, based on valuation methodologies such as appraisals, local market conditions, and current and projected operating performance.
•Fair value estimates for buy-in annuity policies (excluding the MDLZ Global Plan buy-in) are calculated on a replacement policy value basis by discounting the projected cash flows of the plan members using a discount rate based on risk-free rates and adjustments for estimated levels of insurer pricing. Fair value of the MDLZ Global Plan buy-in annuity is set equal to the estimated contract value as of December 31, 2024.
•Net asset value – primarily includes equity funds, fixed income funds, real estate funds, hedge funds and private equity investments for which net asset values are normally used.
Changes in our Level 3 plan assets included:
| Asset Category | January 1, 2024 Balance | Net Realized and Unrealized Gains/ (Losses) | Net Purchases, Issuances and Settlements | Net Transfers Into/(Out of) Level 3 | Currency Impact | December 31, 2024 Balance | ||||||||||||||||||||||||||||||||
| (in millions) | ||||||||||||||||||||||||||||||||||||||
Buy-in annuity contracts and other | $ | $ | ( | $ | $ | $ | ( | $ | ||||||||||||||||||||||||||||||
| Real estate | ||||||||||||||||||||||||||||||||||||||
| Private equity and other | ||||||||||||||||||||||||||||||||||||||
| Total Level 3 investments | $ | $ | ( | $ | $ | $ | ( | $ | ||||||||||||||||||||||||||||||
| Asset Category | January 1, 2023 Balance | Net Realized and Unrealized Gains/ (Losses) | Net Purchases, Issuances and Settlements | Net Transfers Into/(Out of) Level 3 | Currency Impact | December 31, 2023 Balance | ||||||||||||||||||||||||||||||||
| (in millions) | ||||||||||||||||||||||||||||||||||||||
Buy-in annuity contracts and other | $ | $ | $ | ( | $ | $ | $ | |||||||||||||||||||||||||||||||
| Real estate | ( | ( | ||||||||||||||||||||||||||||||||||||
| Private equity and other | ( | |||||||||||||||||||||||||||||||||||||
| Total Level 3 investments | $ | $ | $ | ( | $ | $ | $ | |||||||||||||||||||||||||||||||
The increase in Level 3 pension plan investments during 2024 was related to net purchases, issuances and settlements, including the purchase of the MDLZ Global Plan buy-in annuity, partially offset by a decreased return on plan assets and currency impact. The decrease in Level 3 pension plan investments during 2023 was related to net purchases, issuances and settlements of corporate bonds and other fixed income securities, partially offset by currency impact and net realized and unrealized gains.
101 | | |||||||
The percentage of fair value of pension plan assets was:
| U.S. Plans | Non-U.S. Plans | |||||||||||||||||||||||||
| As of December 31, | As of December 31, | |||||||||||||||||||||||||
| Asset Category | 2024 | 2023 | 2024 | 2023 | ||||||||||||||||||||||
| Equity securities | ||||||||||||||||||||||||||
| Fixed-income securities | ||||||||||||||||||||||||||
| Real estate | ||||||||||||||||||||||||||
Buy-in annuity contracts | ||||||||||||||||||||||||||
| Cash | ||||||||||||||||||||||||||
| Total | ||||||||||||||||||||||||||
For the MDLZ Global Plan, our assets have been exchanged for buy-in annuity contracts to cover all plan liabilities. For our remaining U.S. plans, our investment strategy is to reduce our funded status risk in part through appropriate asset allocation within our plan assets. We attempt to maintain our target asset allocation by rebalancing between asset classes as we make monthly benefit payments. The strategy involves using indexed U.S. equity and international equity securities and actively managed U.S. investment grade fixed-income securities (which constitute 95 % or more of fixed-income securities) with smaller allocations to high yield fixed-income securities.
For our non-U.S. plans, the investment strategy is subject to local regulations and the asset/liability profiles of the plans in each individual country. In aggregate, the asset allocation targets of our non-U.S. plans are broadly characterized as a mix of approximately 13 % equity securities, 56 % fixed-income securities, 27 % buy-in annuity contracts and 4 % real estate.
Employer Contributions
In 2024, we contributed $4 million to our U.S. pension plans and $86 million to our non-U.S. pension plans. In addition, employees contributed $23 million to our non-U.S. plans. We make contributions to our pension plans in accordance with local funding arrangements and statutory minimum funding requirements. Discretionary contributions are made to the extent that they are tax deductible and do not generate an excise tax liability. In 2025, we estimate that our pension contributions will be $11 million to our U.S. plans and $68 million to our non-U.S. plans based on current tax laws. Our actual contributions may be different due to many factors, including changes in tax and other benefit laws, significant differences between expected and actual pension asset performance or interest rates.
Future Benefit Payments
The estimated future benefit payments from our pension plans at December 31, 2024 were (in millions):
| 2025 | 2026 | 2027 | 2028 | 2029 | 2030-2034 | ||||||||||||||||||||||||||||||
| U.S. Plans | $ | $ | $ | $ | $ | $ | |||||||||||||||||||||||||||||
| Non-U.S. Plans | |||||||||||||||||||||||||||||||||||
The increase in estimated benefit payments for U.S. plans in 2025 is reflective of the expected MDLZ Global Plan buy-out.
Multiemployer Pension Plans
In accordance with obligations we have under collective bargaining agreements, we made contributions to multiemployer pension plans for continuing participation and these amounts were not material. Our contributions are based on our contribution rates under our collective bargaining agreements, the number of our eligible employees and fund surcharges.
On July 11, 2019, we received a withdrawal liability assessment from the Bakery and Confectionery Union and Industry International Pension Fund and recorded a discounted liability of $491 million requiring pro-rata monthly payments over 20 years beginning in the third quarter of 2019. Within interest and other expense, net, we recorded accreted interest of $10 million in 2024, $10 million in 2023 and $11 million 2022. As of December 31, 2024, the remaining discounted withdrawal liability was $311 million, with $16 million recorded in other current liabilities and $295 million recorded in long-term other liabilities.
102 | | |||||||
Other Costs
We sponsor and contribute to employee defined contribution plans. These plans cover eligible salaried, non-union and union employees. Our contributions and costs are determined by the matching of employee contributions, as defined by the plans. Amounts charged to expense in continuing operations for defined contribution plans totaled $68 million in 2024 and $66
Postretirement Benefit Plans
Obligations
The changes in and the amount of the accrued benefit obligation of U.S. and non-U.S. plans were:
| As of December 31, | |||||||||||
| 2024 | 2023 | ||||||||||
| (in millions) | |||||||||||
| Accrued benefit obligation at January 1 | $ | $ | |||||||||
| Service cost | |||||||||||
| Interest cost | |||||||||||
| Benefits paid | ( | ( | |||||||||
| Plan amendments | ( | ||||||||||
| Currency | ( | ||||||||||
Actuarial gains | ( | ( | |||||||||
| Accrued benefit obligation at December 31 | |||||||||||
Fair value of plan assets at January 1 | |||||||||||
| Employer Contributions | |||||||||||
| Benefit Payments | ( | ( | |||||||||
| Actual Return on Assets | |||||||||||
| Fair value of plan assets at December 31 | $ | $ | |||||||||
The fair value of plan assets as of December 31, 2024 pertain to the U.S. plan as our postretirement health care plans are funded in the U.S.
The current portion of our accrued postretirement benefit obligation of $11
The actuarial gains for all postretirement plans in 2024 and 2023 were driven by gains related to assumption changes including discount rates used to measure the benefit obligations of those plans.
We used the following weighted-average assumptions to determine our postretirement benefit obligations:
| U.S. Plans | Non-U.S. Plans | ||||||||||||||||||||||
| As of December 31, | As of December 31, | ||||||||||||||||||||||
| 2024 | 2023 | 2024 | 2023 | ||||||||||||||||||||
| Discount rate | % | % | % | % | |||||||||||||||||||
Health care cost trend rate assumed for next year | % | % | % | % | |||||||||||||||||||
Ultimate health care cost trend rate | % | % | % | % | |||||||||||||||||||
| Year that the rate reaches the ultimate trend rate | 2031 | 2031 | 2040 | 2040 | |||||||||||||||||||
Year-end discount rates for our U.S., Canadian and U.K. plans were developed from a model portfolio of high quality, fixed-income debt instruments with durations that match the expected future cash flows of the benefit obligations. Year-end discount rates for our remaining non-U.S. plans were developed from local bond indices that match local benefit obligations as closely as possible. Changes in our discount rates were primarily the result of changes in bond yields year-over-year. Our expected health care cost trend rate is based on historical costs.
103 | | |||||||
For the periods presented, we measure service and interest costs for other postretirement benefits by applying the specific spot rates along a yield curve used to measure plan obligations to the plans’ liability cash flows. We believe this approach provides a good measurement of service and interest costs by aligning the timing of the plans’ liability cash flows to the corresponding spot rates on the yield curve.
Components of Net Periodic Postretirement Health Care Costs
The net periodic postretirement (benefit)/cost was $(11 ) million, $(5 ) million and $12 million for the years ended December 31, 2024, 2023 and 2022, respectively.
We used the following weighted-average assumptions to determine our net periodic postretirement health care cost:
| U.S. Plans | Non-U.S. Plans | ||||||||||||||||||||||||||||||||||
| For the Years Ended December 31, | For the Years Ended December 31, | ||||||||||||||||||||||||||||||||||
| 2024 | 2023 | 2022 | 2024 | 2023 | 2022 | ||||||||||||||||||||||||||||||
| Discount rate | |||||||||||||||||||||||||||||||||||
| Expected rate of return on plan assets | |||||||||||||||||||||||||||||||||||
| Health care cost trend rate | |||||||||||||||||||||||||||||||||||
Future Benefit Payments
Our estimated future benefit payments for our postretirement health care plans at December 31, 2024 were (in millions):
| 2025 | 2026 | 2027 | 2028 | 2029 | 2030-2034 | ||||||||||||||||||||||||||||||
| U.S. Plans | $ | $ | $ | $ | $ | $ | |||||||||||||||||||||||||||||
| Non-U.S. Plans | |||||||||||||||||||||||||||||||||||
Other Costs
We made contributions to multiemployer medical plans totaling $17 million in 2024, $18 million in 2023 and $17 million in 2022. These plans provide medical benefits to active employees and retirees under certain collective bargaining agreements.
Postemployment Benefit Plans
Obligations
Our postemployment plans are not funded. The changes in and the amount of the accrued benefit obligation were:
| As of December 31, | |||||||||||
| 2024 | 2023 | ||||||||||
| (in millions) | |||||||||||
| Accrued benefit obligation at January 1 | $ | $ | |||||||||
| Service cost | |||||||||||
| Interest cost | |||||||||||
| Benefits paid | ( | ( | |||||||||
Actuarial losses | |||||||||||
| Accrued benefit obligation at December 31 | $ | $ | |||||||||
The accrued benefit obligation was determined using a weighted-average discount rate of 9.1 % in 2024 and 8.1 % in 2023, an assumed weighted-average ultimate annual turnover rate of 0.8 % in 2024 and 2023, assumed compensation cost increases of 4.0 % in 2024 and 2023 and assumed benefits as defined in the respective plans.
Postemployment costs arising from actions that offer employees benefits in excess of those specified in the respective plans are charged to expense when incurred.
104 | | |||||||
Components of Net Periodic Postemployment Costs
The net periodic postemployment cost was $20 million, $4 million and zero for the years ended December 31, 2024, 2023 and 2022, respectively.
As of December 31, 2024, the estimated net gain for the postemployment benefit plans that we expect to amortize from accumulated other comprehensive earnings/(losses) into net periodic postemployment costs during 2025 is approximately $4 million.
Note 12. Stock Plans
On May 22, 2024, our shareholders approved the 2024 Performance Incentive Plan (the “2024 PIP”), which replaced our Amended and Restated 2005 Performance Incentive Plan (the “2005 Plan”). Under the 2024 PIP, we are now authorized to issue a maximum of 50.7 million shares of our Common Stock. During the year ended December 31, 2024, we granted 154,907 shares under the 2024 PIP and 391,513 shares were forfeited, which were added to the 2024 PIP. As of December 31, 2024, there were 50.9 million shares available to be granted.
Stock Options
We recorded compensation expense related to stock options held by our employees of $30 million in 2024, $25 million in 2023 and $20 million in 2022 in our results from continuing operations. The deferred tax benefit recorded related to this compensation expense was $5 million in 2024, $4 million in 2023 and $3 million in 2022. The unamortized compensation expense related to our employee stock options was $26 million at December 31, 2024 and is expected to be recognized over a weighted-average period of 1.6 years.
Our weighted-average Black-Scholes Model fair value assumptions were:
| Risk-Free Interest Rate | Expected Life | Expected Volatility | Expected Dividend Yield | Fair Value at Grant Date | |||||||||||||||||||||||||
| 2024 | $ | ||||||||||||||||||||||||||||
| 2023 | $ | ||||||||||||||||||||||||||||
| 2022 | $ | ||||||||||||||||||||||||||||
The risk-free interest rate represents the constant maturity U.S. government treasuries rate with a remaining term equal to the expected life of the options. The expected life is the period over which our employees are expected to hold their options. Volatility reflects historical movements in our stock price for a period commensurate with the expected life of the options. The dividend yield reflects the dividend yield in place at the time of the historical grants.
105 | | |||||||
Stock option activity is reflected below:
| Shares Subject to Option | Weighted- Average Exercise or Grant Price Per Share | Average Remaining Contractual Term | Aggregate Intrinsic Value | ||||||||||||||||||||
| Balance at January 1, 2022 | $ | $ | million | ||||||||||||||||||||
| Annual grant to eligible employees | |||||||||||||||||||||||
| Additional options issued | |||||||||||||||||||||||
| Total options granted | |||||||||||||||||||||||
Options exercised (1) | ( | $ | million | ||||||||||||||||||||
| Options cancelled | ( | ||||||||||||||||||||||
| Balance at December 31, 2022 | $ | million | |||||||||||||||||||||
| Annual grant to eligible employees | |||||||||||||||||||||||
| Additional options issued | |||||||||||||||||||||||
| Total options granted | |||||||||||||||||||||||
Options exercised (1) | ( | $ | million | ||||||||||||||||||||
| Options cancelled | ( | ||||||||||||||||||||||
| Balance at December 31, 2023 | $ | million | |||||||||||||||||||||
| Annual grant to eligible employees | |||||||||||||||||||||||
| Additional options issued | |||||||||||||||||||||||
| Total options granted | |||||||||||||||||||||||
Options exercised (1) | ( | $ | million | ||||||||||||||||||||
| Options cancelled | ( | ||||||||||||||||||||||
| Balance at December 31, 2024 | $ | million | |||||||||||||||||||||
| Exercisable at December 31, 2024 | $ | million | |||||||||||||||||||||
(1)Cash received from options exercised was $175 million in 2024, $152 million in 2023 and $158 million in 2022. The actual tax benefit realized and recorded in the provision for income taxes for the tax deductions from the option exercises totaled $19 million in 2024, $21 million in 2023 and $22 million in 2022.
106 | | |||||||
Deferred Stock Units, Performance Share Units and Other Stock-Based Awards
We recorded compensation expense related to DSUs, PSUs and other stock-based awards of $117 million in 2024, $121 million in 2023 and $100 million in 2022 in our results from continuing operations. The deferred tax benefit recorded related to this compensation expense was $19 million in 2024, $18 million in 2023 and $17 million in 2022. The unamortized compensation expense related to our DSUs, PSUs and other stock-based awards was $132 million at December 31, 2024 and is expected to be recognized over a weighted-average period of 1.6 years.
Our PSU, DSU and other stock-based award activity is reflected below:
| Number of Shares | Weighted-Average Fair Value Per Share (4) | Weighted-Average Aggregate Fair Value (3) | |||||||||||||||
| Balance at January 1, 2022 | $ | ||||||||||||||||
| Annual grant to eligible employees: | |||||||||||||||||
| Performance share units | |||||||||||||||||
| Deferred stock units | |||||||||||||||||
Additional shares granted (1) | |||||||||||||||||
| Total shares granted | $ | million | |||||||||||||||
Vested (2) (3) | ( | $ | million | ||||||||||||||
Forfeited (2) | ( | ||||||||||||||||
| Balance at December 31, 2022 | |||||||||||||||||
| Annual grant to eligible employees: | |||||||||||||||||
| Performance share units | |||||||||||||||||
| Deferred stock units | |||||||||||||||||
Additional shares granted (1) | |||||||||||||||||
| Total shares granted | $ | million | |||||||||||||||
Vested (2) (3) | ( | $ | million | ||||||||||||||
Forfeited (2) | ( | ||||||||||||||||
| Balance at December 31, 2023 | |||||||||||||||||
| Annual grant to eligible employees: | |||||||||||||||||
| Performance share units | |||||||||||||||||
| Deferred stock units | |||||||||||||||||
Additional shares granted (1) | |||||||||||||||||
| Total shares granted | $ | million | |||||||||||||||
Vested (2) (3) | ( | $ | million | ||||||||||||||
Forfeited (2) | ( | ||||||||||||||||
| Balance at December 31, 2024 | |||||||||||||||||
(1)Includes PSUs and DSUs.
(2)Includes PSUs, DSUs and other stock-based awards.
(3)The actual tax benefit realized and recorded in the provision for income taxes for the tax deductions from the shares vested totaled $7 million in 2024, $3 million in 2023 and $5 million in 2022.
(4)The grant date fair value of PSUs is determined based on the Monte Carlo simulation model for the market-based total shareholder return component and the closing market price of the Company’s stock on the grant date for performance-based components. The Monte Carlo simulation model incorporates the probability of achieving the total shareholder return market condition. Compensation expense is recognized using the grant date fair values regardless of whether the market condition is achieved, so long as the requisite service has been provided.
107 | | |||||||
Note 13. Capital Stock
Our amended and restated articles of incorporation authorize 5.0 billion shares of Common Stock and 500 million shares of preferred stock. There were no Shares of Common Stock issued, in treasury and outstanding, were:
| Shares Issued | Treasury Shares | Shares Outstanding | ||||||||||||||||||
| Balance at January 1, 2022 | ( | |||||||||||||||||||
| Shares repurchased | — | ( | ( | |||||||||||||||||
| Exercise of stock options and issuance of other stock awards | ||||||||||||||||||||
| Balance at December 31, 2022 | ( | |||||||||||||||||||
| Shares repurchased | — | ( | ( | |||||||||||||||||
| Exercise of stock options and issuance of other stock awards | ||||||||||||||||||||
| Balance at December 31, 2023 | ( | |||||||||||||||||||
| Shares repurchased | — | ( | ( | |||||||||||||||||
| Exercise of stock options and issuance of other stock awards | ||||||||||||||||||||
| Balance at December 31, 2024 | ( | |||||||||||||||||||
Stock plan awards to employees and non-employee directors are issued from treasury shares. At December 31, 2024, 71.9 million shares of Common Stock held in treasury were reserved for stock options and other stock awards.
Share Repurchase Program
Effective January 1, 2023, our Board of Directors approved a program authorizing the repurchase of $6.0 billion of our Common Stock through December 31, 2025. Repurchases under the program are determined by management and are wholly discretionary. During the year ended December 31, 2023, we repurchased approximately $1.6 billion of Common Stock pursuant to this authorization.
During the year ended December 31, 2024, we repurchased approximately 36 million shares of Common Stock at an average cost of $65.51 per share, or an aggregate cost of approximately $2.4 billion, all of which was paid during the period except for approximately $67 million settled in January 2025. All share repurchases were funded through available cash and commercial paper issuances. On December 10, 2024, our Board of Directors approved a new program authorizing the repurchase of up to $9.0 billion of our Common Stock through December 31, 2027. This authorization, effective January 1, 2025, replaced our prior share repurchase program.
108 | | |||||||
Note 14. Commitments and Contingencies
Legal Proceedings
We routinely are involved in various pending or threatened legal proceedings, claims, disputes, regulatory matters and governmental inquiries, inspections or investigations arising in the ordinary course of or incidental to our business, including those noted below in this section. We record provisions in the consolidated financial statements for pending legal matters when we determine that an unfavorable outcome is probable, and the amount of the loss can be reasonably estimated. For matters we have not provided for that are reasonably possible to result in an unfavorable outcome, management is unable to estimate the possible loss or range of loss or such amounts have been determined to be immaterial. At present we believe that the ultimate outcome of these legal proceedings and regulatory and governmental matters, individually and in the aggregate, will not materially harm our financial position, results of operations or cash flows. However, legal proceedings and regulatory and governmental matters are subject to inherent uncertainties, and unfavorable rulings or other events could occur. Unfavorable resolutions could involve substantial fines, civil or criminal penalties, and other expenditures. In addition, in matters for which conduct remedies are sought, unfavorable resolutions could include an injunction or other order prohibiting us from selling one or more products at all or in particular ways, precluding particular business practices or requiring other equitable remedies. An unfavorable outcome might result in a material adverse impact on our business, results of operations or financial position.
On April 1, 2015, the U.S. Commodity Futures Trading Commission ("CFTC") filed a complaint against Kraft Foods Group and Mondelēz Global LLC (“Mondelēz Global”) in the U.S. District Court for the Northern District of Illinois (the "District Court") related to the trading of December 2011 wheat futures contracts that occurred prior to the spin-off of Kraft Foods Group. The complaint alleged that Mondelēz Global: (1) manipulated or attempted to manipulate the wheat markets during the fall of 2011; (2) violated position limit levels for wheat futures; and (3) engaged in non-competitive trades. On May 13, 2022, the District Court approved a settlement agreement between the CFTC and Mondelēz Global. The terms of the settlement, which are available in the District Court’s docket, had an immaterial impact on our financial position, results of operations and cash flows and did not include an admission by Mondelēz Global. Several class action complaints also were filed against Mondelēz Global in the District Court by investors who copied and expanded upon the CFTC allegations in a series of private claims for monetary damages as well as injunctive, declaratory, and other unspecified relief. In June 2015, these suits were consolidated in the United States District Court for the Northern District of Illinois as case number 15-cv-2937, Harry Ploss et al. v. Kraft Foods Group, Inc. and Mondelēz Global LLC. On January 3, 2020, the District Court granted plaintiffs' request to certify a class. In November 2022, the District Court adjourned the trial date it had previously set for November 30, 2022 and ordered the parties to brief Kraft’s motions to decertify the class and for summary judgment, which has been completed. It is not possible to predict the outcome of these matters; however, based on our Separation and Distribution Agreement with Kraft Foods Group dated as of September 27, 2012, we expect to bear any monetary penalties or other payments in connection with the class action.
As previously disclosed, in November 2019, the European Commission informed us that it initiated an investigation into our alleged infringement of European Union competition law through certain practices allegedly restricting cross-border trade within the European Economic Area. On January 28, 2021, the European Commission announced it had taken the next procedural step in its investigation and opened formal proceedings. As previously disclosed, we have cooperated with the investigation. In the fourth quarter of 2022, we had accrued (in accordance with U.S. GAAP), on a pre-tax basis, a liability of €300 million ($321 million) within other current liabilities in the consolidated balance sheet and selling, general and administrative expenses in the consolidated statement of earnings as an estimate of the possible cost to resolve this matter. During the fourth quarter of 2023, we adjusted our accrual to a liability of €340 million ($375 million). In the second quarter of 2024, we reached a negotiated resolution in this matter and adjusted our accrual from a liability of €340 million to €337.5 million ($376 million), on a pre-tax basis. Pursuant to the terms of the agreed settlement, we fulfilled our payment obligation in August 2024. We do not anticipate any modification of our business practices and agreements that would have a material impact on our ongoing business operations within the European Union.
Third-Party Guarantees
We enter into third-party guarantees primarily to cover long-term obligations of our vendors. As part of these transactions, we guarantee that third parties will make contractual payments or achieve performance measures. As of December 31, 2024 and December 31, 2023, we had no material third-party guarantees recorded on our consolidated balance sheets.
109 | | |||||||
Tax Matters
We are a party to various tax matter proceedings incidental to our business. These proceedings are subject to inherent uncertainties, and unfavorable outcomes could subject us to additional tax liabilities and could materially adversely impact our business, results of operations or financial position.
110 | | |||||||
Note 15. Reclassifications from Accumulated Other Comprehensive Income
The following table summarizes the changes in the accumulated balances of each component of accumulated other comprehensive earnings/(losses) attributable to Mondelēz International. Amounts reclassified from accumulated other comprehensive earnings/(losses) to net earnings (net of tax) were net losses/(gains) of $21 million in 2024, $84 million in 2023 and $21 million in 2022.
| For the Years Ended December 31, | |||||||||||||||||
| 2024 | 2023 | 2022 | |||||||||||||||
| (in millions) | |||||||||||||||||
| Currency Translation Adjustments: | |||||||||||||||||
| Balance at beginning of period | $ | ( | $ | ( | $ | ( | |||||||||||
| Currency translation adjustments | ( | ( | |||||||||||||||
Tax effect | ( | ( | |||||||||||||||
| Other comprehensive earnings/(losses) | ( | ( | |||||||||||||||
less: other comprehensive (earnings)/loss attributable to noncontrolling interests | |||||||||||||||||
| Balance at end of period | ( | ( | ( | ||||||||||||||
| Pension and Other Benefit Plans: | |||||||||||||||||
| Balance at beginning of period | $ | ( | $ | ( | $ | ( | |||||||||||
| Net actuarial gain/(loss) arising during period | ( | ( | |||||||||||||||
Tax effect on net actuarial gain/(loss) | ( | ||||||||||||||||
| Losses/(gains) reclassified into net earnings: | |||||||||||||||||
Amortization of experience losses and prior service costs (1) | |||||||||||||||||
Settlement losses and other expenses (1) | |||||||||||||||||
Curtailment credit (1) | ( | ||||||||||||||||
Tax (benefit) on reclassifications (3) | ( | ( | ( | ||||||||||||||
| Currency impact | ( | ||||||||||||||||
| Other comprehensive earnings/(losses) | ( | ( | |||||||||||||||
| Balance at end of period | ( | ( | ( | ||||||||||||||
| Derivative Cash Flow Hedges: | |||||||||||||||||
| Balance at beginning of period | $ | ( | $ | ( | $ | ( | |||||||||||
| Net derivative gains/(losses) | ( | ||||||||||||||||
Tax effect on net derivative gain/(loss) | ( | ( | |||||||||||||||
| Losses/(gains) reclassified into net earnings: | |||||||||||||||||
Currency exchange contracts (2) | |||||||||||||||||
Interest rate contracts (2) | ( | ( | |||||||||||||||
Tax (benefit) on reclassifications (3) | ( | ( | |||||||||||||||
| Currency impact | ( | ||||||||||||||||
| Other comprehensive earnings/(losses) | ( | ( | |||||||||||||||
| Balance at end of period | ( | ( | ( | ||||||||||||||
| Accumulated other comprehensive income attributable to Mondelēz International: | |||||||||||||||||
| Balance at beginning of period | $ | ( | $ | ( | $ | ( | |||||||||||
| Total other comprehensive earnings/(losses) | ( | ( | ( | ||||||||||||||
less: other comprehensive (earnings)/loss attributable to noncontrolling interests | |||||||||||||||||
| Other comprehensive earnings/(losses) attributable to Mondelēz International | ( | ( | |||||||||||||||
| Balance at end of period | $ | ( | $ | ( | $ | ( | |||||||||||
(1)These reclassified losses are included in net periodic benefit costs disclosed in Note 11, Benefit Plans.
(2)These reclassified losses are recorded within interest and other expense, net.
(3)Taxes reclassified to earnings are recorded within the provision for income taxes.
111 | | |||||||
Note 16. Income Taxes
Earnings/(losses) from continuing operations before income taxes and the provision for income taxes consisted of:
| For the Years Ended December 31, | |||||||||||||||||
| 2024 | 2023 | 2022 | |||||||||||||||
| (in millions) | |||||||||||||||||
| Earnings/(losses) from continuing operations before income taxes: | |||||||||||||||||
| United States | $ | $ | $ | ||||||||||||||
| Outside United States | |||||||||||||||||
| $ | $ | $ | |||||||||||||||
| Provision for income taxes: | |||||||||||||||||
| United States federal: | |||||||||||||||||
| Current | $ | $ | $ | ||||||||||||||
| Deferred | ( | ( | |||||||||||||||
| State and local: | |||||||||||||||||
| Current | |||||||||||||||||
| Deferred | ( | ||||||||||||||||
| Total United States | |||||||||||||||||
| Outside United States: | |||||||||||||||||
| Current | |||||||||||||||||
| Deferred | ( | ||||||||||||||||
| Total outside United States | |||||||||||||||||
| Total provision for income taxes | $ | $ | $ | ||||||||||||||
The effective income tax rate on pre-tax earnings differed from the U.S. federal statutory rate as follows:
| For the Years Ended December 31, | |||||||||||||||||
| 2024 | 2023 | 2022 | |||||||||||||||
| U.S. federal statutory rate | |||||||||||||||||
| Increase/(decrease) resulting from: | |||||||||||||||||
| State and local income taxes, net of federal tax benefit | ( | ||||||||||||||||
Foreign rate differences | |||||||||||||||||
| Changes in judgment on realizability of deferred tax assets | ( | ( | ( | ||||||||||||||
Net change in tax accruals | ( | ( | |||||||||||||||
Tax accrual on investment in KDP (including tax impact of share sales) | |||||||||||||||||
| Excess tax benefits from equity compensation | ( | ( | ( | ||||||||||||||
| Tax legislation | |||||||||||||||||
Business sales | ( | ||||||||||||||||
Tax benefit from legal entity reorganization | ( | ||||||||||||||||
Foreign tax provisions under TCJA (GILTI, FDII and BEAT) (1) | |||||||||||||||||
Tax impacts from the European Commission legal matter | ( | ||||||||||||||||
Non-deductible expenses and other, including buyout of Clif Bar ESOP | |||||||||||||||||
| Effective tax rate | |||||||||||||||||
(1)The Tax Cuts and Jobs Act of 2017 (“TCJA”) established the Global Intangible Low-Tax Income (“GILTI”) provision, which taxes U.S. allocated expenses and certain income from foreign operations; the Foreign-Derived Intangible Income (“FDII”) provision, which allows a deduction against certain types of U.S. taxable income resulting in a lower effective U.S. tax rate on such income; and the Base Erosion Anti-abuse Tax (“BEAT”), which is a minimum tax based on cross-border service payments by U.S. entities.
112 | | |||||||
Our 2024 effective tax rate of 23.5 % was higher than the 21% U.S. federal statutory rate due to the net unfavorable impact attributable to jurisdictional mix of pretax income and applicable tax rates as well as unfavorable foreign provisions under U.S. tax laws, partially offset by a net benefit resulting from a legal entity reorganization associated with a prior year acquisition.
Our 2023 effective tax rate of 26.1 % was higher than the 21% U.S. federal statutory rate due to a $125 million net tax expense incurred in connection with the KDP share sale during the first quarter of 2023 (the earnings were reported separately on our statement of earnings and thus not included in earnings before income taxes). Excluding these impacts, our effective tax rate was 24.0 %, which reflects unfavorable foreign provisions under U.S. tax laws as well as net unfavorable impacts from the mix of pre-tax income and applicable tax rates in various non-U.S. jurisdictions. The 24.0 % included a $150 million net tax expense related to pre-tax gains and losses on KDP marketable securities. It also included a favorable discrete net tax benefit of $40 million, driven primarily by a $51 million net benefit from the release of liabilities for uncertain tax positions due to expirations of statutes of limitations and audit settlements in several jurisdictions and a $24 million benefit for the expected tax deduction on the European Commission legal matter, partially offset by a $63 million expense from updating our Swiss tax reform position in Switzerland as it relates to the 2024 tax year.
Our 2022 effective tax rate of 26.8 % was higher than the 21% U.S. federal statutory rate due to the buyout of the Clif Bar ESOP that was recorded to earnings before income taxes and the European Commission legal matter, for which there is no associated income tax benefits. Excluding these impacts, our effective tax rate was 22.6 %, which reflects unfavorable provisions from the U.S. tax laws and the establishment of a valuation allowance related to a deferred tax asset arising from the 2022 Ukraine loss, largely offset by net favorable impacts from the mix of pre-tax income and applicable tax rates in various non-U.S. jurisdictions. The 22.6 % includes a favorable discrete net tax benefit of $96 million, driven by a $72 million net benefit from the release of liabilities for uncertain tax positions due to expirations of statutes of limitations and audit settlements in several jurisdictions and a $51 million net benefit from the Chipita acquisition, partially offset by $17 million expense from tax law changes in various jurisdictions.
113 | | |||||||
Tax effects of temporary differences that gave rise to deferred income tax assets and liabilities consisted of:
| As of December 31, | |||||||||||
| 2024 | 2023 | ||||||||||
| (in millions) | |||||||||||
| Deferred income tax assets: | |||||||||||
| Accrued postretirement and postemployment benefits | $ | $ | |||||||||
| Other employee benefits | |||||||||||
| Accrued expenses | |||||||||||
| Loss carryforwards | |||||||||||
| Tax credit carryforwards | |||||||||||
| Other | |||||||||||
| Total deferred income tax assets | |||||||||||
| Valuation allowance | ( | ( | |||||||||
| Net deferred income tax assets | $ | $ | |||||||||
| Deferred income tax liabilities: | |||||||||||
Intangible assets | $ | ( | $ | ( | |||||||
| Property, plant and equipment | ( | ( | |||||||||
| Accrued pension costs | ( | ( | |||||||||
| Other | ( | ( | |||||||||
| Total deferred income tax liabilities | ( | ( | |||||||||
| Net deferred income tax liabilities | $ | ( | $ | ( | |||||||
Our significant valuation allowances are in the U.S. and Switzerland. The U.S. valuation allowance relates to excess foreign tax credits generated by the deemed repatriation under U.S. tax reform while the Swiss valuation allowance reduces the amortizable intangible assets to the amount more likely than not to be realized. Our total valuation allowance was $1,359 million as of January 1, 2024 and $1,291 million as of December 31, 2024. The $(68 ) million net change, which includes currency impacts, consisted of $65 million additions less $133 million reductions.
At December 31, 2024, the Company has tax-effected loss carryforwards of $681 million, of which $32 million will expire at various dates between 2025 and 2044 and the remaining $649 million can be carried forward indefinitely.
As of December 31, 2024, the company is indefinitely reinvested in unremitted earnings of approximately $4.5 billion, of which approximately $1.4 billion has already been subject to U.S. tax but would incur approximately $99 million of local costs if repatriated, which has not been recognized in our financial statements. It is not practicable to quantify the total U.S. tax impact from all our indefinitely reinvested earnings. Future tax law changes or changes in the needs of our non-U.S. subsidiaries could require us to recognize deferred tax liabilities on a portion, or all, of our accumulated earnings that are currently indefinitely reinvested.
114 | | |||||||
The changes in our unrecognized tax benefits were:
| For the Years Ended December 31, | |||||||||||||||||
| 2024 | 2023 | 2022 | |||||||||||||||
| (in millions) | |||||||||||||||||
| January 1 | $ | $ | $ | ||||||||||||||
| Increases from positions taken during prior periods | |||||||||||||||||
| Decreases from positions taken during prior periods | ( | ( | ( | ||||||||||||||
| Increases from positions taken during the current period | |||||||||||||||||
| Decreases relating to settlements with taxing authorities | ( | ( | ( | ||||||||||||||
Reductions resulting from the lapse of the applicable statute of limitations | ( | ( | ( | ||||||||||||||
| Currency/other | ( | ( | |||||||||||||||
| December 31 | $ | $ | $ | ||||||||||||||
As of January 1, 2024, our unrecognized tax benefits were $442 million. If we had recognized all of these benefits, the net impact on our income tax provision would have been $348 million. Our unrecognized tax benefits were $436 million at December 31, 2024, and if we had recognized all of these benefits, the net impact on our income tax provision would have been $348 million. Within the next 12 months, our unrecognized tax benefits could increase by approximately $25 million or decrease by approximately $65 million due to audit developments and the expiration of statutes of limitations in various jurisdictions. We include accrued interest and penalties related to uncertain tax positions in our tax provision. We had accrued interest and penalties of $173 million as of January 1, 2024 and $190 million as of December 31, 2024. Our 2024 provision for income taxes included $26 million expense for interest and penalties.
In connection with the 2017 enacted U.S. tax reform, we recorded a $1.3 billion transition tax liability that is payable in installments through 2026. As of December 31, 2024, the remaining liability was approximately $360 million.
Our income tax filings are regularly examined by federal, state and non-U.S. tax authorities. U.S. federal, state and non-U.S. jurisdictions have statutes of limitations generally ranging from three to five years; however, these statutes are often extended by mutual agreement with the tax authorities. The earliest year still open to examination by U.S. federal and state tax authorities is 2016 and years still open to examination by non-U.S. tax authorities in major jurisdictions include (earliest open tax year in parentheses): India (2005), Switzerland (2019), China (2014), United Kingdom (2015), and Greece (2018).
115 | | |||||||
Note 17. Earnings per Share
Basic and diluted earnings per share (“EPS”) were calculated as follows:
| For the Years Ended December 31, | |||||||||||||||||
| 2024 | 2023 | 2022 | |||||||||||||||
| (in millions, except per share data) | |||||||||||||||||
| Net earnings | $ | $ | $ | ||||||||||||||
less: Noncontrolling interest earnings | ( | ( | ( | ||||||||||||||
| Net earnings attributable to Mondelēz International | $ | $ | $ | ||||||||||||||
| Weighted-average shares for basic EPS | |||||||||||||||||
| Plus incremental shares from assumed conversions of stock options and long-term incentive plan shares | |||||||||||||||||
| Weighted-average shares for diluted EPS | |||||||||||||||||
| Basic earnings per share attributable to Mondelēz International | $ | $ | $ | ||||||||||||||
| Diluted earnings per share attributable to Mondelēz International | $ | $ | $ | ||||||||||||||
We exclude antidilutive Mondelēz International stock options and long-term incentive plan shares from our calculation of weighted-average shares for diluted EPS, which are 3.4 million for the year ended December 31, 2024, 2.9 million for the year ended December 31, 2023 and 3.0 million for the year ended December 31, 2022.
Note 18. Segment Reporting
We manufacture and market primarily snack food products, including chocolate, biscuits and baked snacks, as well as gum & candy, cheese & grocery and powdered beverages.
We manage our global business and report operating results through geographic units. We manage our operations by region to leverage regional operating scale, manage different and changing business environments more effectively and pursue growth opportunities as they arise across our key markets. Our regional management teams have responsibility for the business, product categories and financial results in the regions.
Our operations and management structure are organized into four operating segments:
•Latin America
•AMEA
•Europe
•North America
116 | | |||||||
Our segment net revenue, significant segment expenses and operating income, by reportable segment were as follows:
| For The Year Ended December 31, 2024 | |||||||||||||||||||||||||||||
| (in millions) | |||||||||||||||||||||||||||||
| Latin America | AMEA | Europe | North America | Total | |||||||||||||||||||||||||
Net revenues | $ | $ | $ | $ | $ | ||||||||||||||||||||||||
| Segment cost of sales | ( | ( | ( | ( | ( | ||||||||||||||||||||||||
Segment selling, general and administrative expenses (1) | ( | ( | ( | ( | ( | ||||||||||||||||||||||||
| Segment operating income | $ | $ | $ | $ | |||||||||||||||||||||||||
Unrealized gains on hedging activities (mark-to-market impacts) | |||||||||||||||||||||||||||||
| General corporate expenses | ( | ||||||||||||||||||||||||||||
| Amortization of intangible assets | ( | ||||||||||||||||||||||||||||
| Net gain on divestitures and acquisitions | |||||||||||||||||||||||||||||
| Acquisition-related costs | ( | ||||||||||||||||||||||||||||
| Operating income | $ | ||||||||||||||||||||||||||||
| For The Year Ended December 31, 2023 | |||||||||||||||||||||||||||||
| (in millions) | |||||||||||||||||||||||||||||
| Latin America | AMEA | Europe | North America | Total | |||||||||||||||||||||||||
Net revenues | $ | $ | $ | $ | $ | ||||||||||||||||||||||||
| Segment cost of sales | ( | ( | ( | ( | ( | ||||||||||||||||||||||||
Segment selling, general and administrative expenses (1) | ( | ( | ( | ( | ( | ||||||||||||||||||||||||
| Segment operating income | $ | $ | $ | $ | |||||||||||||||||||||||||
Unrealized gains on hedging activities (mark-to-market impacts) | |||||||||||||||||||||||||||||
| General corporate expenses | ( | ||||||||||||||||||||||||||||
| Amortization of intangible assets | ( | ||||||||||||||||||||||||||||
| Net gain on divestitures and acquisitions | |||||||||||||||||||||||||||||
| Operating income | $ | ||||||||||||||||||||||||||||
| For The Year Ended December 31, 2022 | |||||||||||||||||||||||||||||
| (in millions) | |||||||||||||||||||||||||||||
| Latin America | AMEA | Europe | North America | Total | |||||||||||||||||||||||||
Net revenues | $ | $ | $ | $ | $ | ||||||||||||||||||||||||
| Segment cost of sales | ( | ( | ( | ( | ( | ||||||||||||||||||||||||
Segment selling, general and administrative expenses (1) | ( | ( | ( | ( | ( | ||||||||||||||||||||||||
| Segment operating income | $ | $ | $ | $ | |||||||||||||||||||||||||
Unrealized losses on hedging activities (mark-to-market impacts) | ( | ||||||||||||||||||||||||||||
| General corporate expenses | ( | ||||||||||||||||||||||||||||
| Amortization of intangible assets | ( | ||||||||||||||||||||||||||||
| Acquisition-related costs | ( | ||||||||||||||||||||||||||||
| Operating income | $ | ||||||||||||||||||||||||||||
(1) SG&A for all reportable segments includes: Advertising & consumer expenses and overhead expenses.
117 | | |||||||
Total depreciation expense and capital expenditures by segment, reflecting our current segment structure for all periods presented, were:
| For the Years Ended December 31, | |||||||||||||||||
| 2024 | 2023 | 2022 | |||||||||||||||
| (in millions) | |||||||||||||||||
Depreciation expense (2): | |||||||||||||||||
| Latin America | $ | $ | $ | ||||||||||||||
| AMEA | |||||||||||||||||
| Europe | |||||||||||||||||
| North America | |||||||||||||||||
Corporate | |||||||||||||||||
| Total depreciation expense | $ | $ | $ | ||||||||||||||
(2)Includes depreciation expense related to owned property, plant and equipment. Does not include amortization of intangible assets or leased assets. Refer to the consolidated statement of cash flows for total depreciation and amortization expenses.
| For the Years Ended December 31, | |||||||||||||||||
| 2024 | 2023 | 2022 | |||||||||||||||
| (in millions) | |||||||||||||||||
| Capital expenditures: | |||||||||||||||||
| Latin America | $ | $ | $ | ||||||||||||||
| AMEA | |||||||||||||||||
| Europe | |||||||||||||||||
| North America | |||||||||||||||||
Corporate | |||||||||||||||||
| Total capital expenditures | $ | $ | $ | ||||||||||||||
Geographic data for net revenues (recognized in the countries where products are sold from) and long-lived assets, excluding deferred taxes, goodwill, intangible assets and equity method investments, were:
| For the Years Ended December 31, | |||||||||||||||||
| 2024 | 2023 | 2022 | |||||||||||||||
| (in millions) | |||||||||||||||||
| Net revenues: | |||||||||||||||||
| United States | $ | $ | $ | ||||||||||||||
| Other | |||||||||||||||||
| Total net revenues | $ | $ | $ | ||||||||||||||
| As of December 31, | |||||||||||||||||
| 2024 | 2023 | 2022 | |||||||||||||||
| (in millions) | |||||||||||||||||
| Long-lived assets: | |||||||||||||||||
| United States | $ | $ | $ | ||||||||||||||
Mexico | |||||||||||||||||
| Other | |||||||||||||||||
| Total long-lived assets | $ | $ | $ | ||||||||||||||
118 | | |||||||
Net revenues by product category, reflecting our current segment structure for all periods presented, were:
| For the Year Ended December 31, 2024 | |||||||||||||||||||||||||||||
| Latin America | AMEA | Europe | North America | Total | |||||||||||||||||||||||||
| (in millions) | |||||||||||||||||||||||||||||
| Biscuits & Baked Snacks | $ | $ | $ | $ | $ | ||||||||||||||||||||||||
| Chocolate | |||||||||||||||||||||||||||||
| Gum & Candy | |||||||||||||||||||||||||||||
| Beverages | |||||||||||||||||||||||||||||
| Cheese & Grocery | |||||||||||||||||||||||||||||
| Total net revenues | $ | $ | $ | $ | $ | ||||||||||||||||||||||||
For the Year Ended December 31, 2023 | |||||||||||||||||||||||||||||
| Latin America | AMEA | Europe | North America | Total | |||||||||||||||||||||||||
| (in millions) | |||||||||||||||||||||||||||||
| Biscuits & Baked Snacks | $ | $ | $ | $ | $ | ||||||||||||||||||||||||
| Chocolate | |||||||||||||||||||||||||||||
| Gum & Candy | |||||||||||||||||||||||||||||
| Beverages | |||||||||||||||||||||||||||||
| Cheese & Grocery | |||||||||||||||||||||||||||||
| Total net revenues | $ | $ | $ | $ | $ | ||||||||||||||||||||||||
For the Year Ended December 31, 2022 | |||||||||||||||||||||||||||||
| Latin America | AMEA | Europe | North America | Total | |||||||||||||||||||||||||
| (in millions) | |||||||||||||||||||||||||||||
| Biscuits & Baked Snacks | $ | $ | $ | $ | $ | ||||||||||||||||||||||||
| Chocolate | |||||||||||||||||||||||||||||
| Gum & Candy | |||||||||||||||||||||||||||||
| Beverages | |||||||||||||||||||||||||||||
| Cheese & Grocery | |||||||||||||||||||||||||||||
| Total net revenues | $ | $ | $ | $ | $ | ||||||||||||||||||||||||
119 | | |||||||
Item 9. Changes in and Disagreements with Accountants on Accounting and Financial Disclosure.
None.
ltem 9A. Controls and Procedures.
Evaluation of Disclosure Controls and Procedures
We have established disclosure controls and procedures that are designed to ensure that information required to be disclosed in our reports filed or submitted under the Exchange Act is recorded, processed, summarized and reported within the time periods specified in the rules and forms of the SEC, and such information is accumulated and communicated to our management, including our Chief Executive Officer (“CEO”) and Chief Financial Officer (“CFO”), as appropriate to allow timely decisions regarding required disclosure. Management, together with our CEO and CFO, evaluated the effectiveness of the Company’s disclosure controls and procedures as of December 31, 2024. Based on this evaluation, the CEO and CFO concluded that our disclosure controls and procedures were effective as of December 31, 2024.
Report of Management on Internal Control Over Financial Reporting
Management is responsible for establishing and maintaining adequate internal control over financial reporting as defined in Rules 13a-15(f) and 15d-15(f) under the Exchange Act. Our internal control over financial reporting is a process designed by, or under the supervision of, our CEO and CFO, or persons performing similar functions, and effected by the Company’s Board of Directors, management and other personnel to provide reasonable assurance regarding the reliability of financial reporting and the preparation of financial statements for external purposes in accordance with generally accepted accounting principles. Our internal control over financial reporting includes those written policies and procedures that:
•pertain to the maintenance of records that, in reasonable detail, accurately and fairly reflect the transactions and dispositions of assets;
•provide reasonable assurance that transactions are recorded as necessary to permit preparation of financial statements in accordance with generally accepted accounting principles;
•provide reasonable assurance that receipts and expenditures are being made only in accordance with management and director authorization; and
•provide reasonable assurance regarding prevention or timely detection of unauthorized acquisition, use or disposition of assets that could have a material effect on the consolidated financial statements.
Because of its inherent limitations, internal control over financial reporting may not prevent or detect misstatements. Also, projections of any evaluation of effectiveness to future periods are subject to the risk that controls may become inadequate because of changes in conditions, or that the degree of compliance with the policies or procedures may deteriorate.
Management assessed the effectiveness of our internal control over financial reporting as of December 31, 2024. Management based this assessment on criteria for effective internal control over financial reporting described in Internal Control Integrated Framework (2013) issued by the Committee of Sponsoring Organizations of the Treadway Commission (“COSO”). The scope of Management’s assessment of internal control over financial reporting excludes Evirth as it was acquired in 2024. The total assets and total net revenues of Evirth represent 0.37% and 0.19% of the related consolidated financial statement amounts as of and for the year ended December 31, 2024.
Based on this assessment, management concluded that the Company’s internal control over financial reporting is effective as of December 31, 2024, based on the criteria in Internal Control Integrated Framework issued by the COSO.
PricewaterhouseCoopers LLP, an independent registered public accounting firm, has audited the effectiveness of our internal control over financial reporting as of December 31, 2024, as stated in their report that appears under Item 8.
February 5, 2025
120 | | |||||||
Changes in Internal Control Over Financial Reporting
Management, together with our CEO and CFO, evaluated the changes in our internal control over financial reporting during the quarter ended December 31, 2024. There were no changes in our internal control over financial reporting during the quarter ended December 31, 2024, that have materially affected, or are reasonably likely to materially affect, our internal control over financial reporting.
Item 9B. Other Information.
(c) Insider Trading Arrangements
Our directors and executive officers may from time to time enter into plans or other arrangements for the purchase or sale of our shares that are intended to satisfy the affirmative defense conditions of Rule 10b5–1(c) or may represent a non-Rule 10b5-1 trading arrangement under the Exchange Act. During the quarter ended December 31, 2024, no such plans or other arrangements were adopted or terminated
Item 9C. Disclosure Regarding Foreign Jurisdictions that Prevent Inspections.
Not applicable.
121 | | |||||||
PART III
Item 10. Directors, Executive Officers and Corporate Governance.
Information required by this Item 10 is included under the heading “Information about our Executive Officers” in Part I, Item 1 of this Form 10-K, as well as under the headings “Election of Directors,” “Corporate Governance – Governance Guidelines,” “Corporate Governance – Codes of Conduct,” “Board Committees and Membership – Audit Committee” and “Ownership of Equity Securities – Delinquent Section 16(a) Reports” in our definitive Proxy Statement for our Annual Meeting of Shareholders scheduled to be held on May 21, 2025 (“2025 Proxy Statement”). All of this information from the 2025 Proxy Statement is incorporated by reference into this Annual Report.
Mondelēz International has adopted a comprehensive insider trading policy governing the purchase, sale and other dispositions of its securities by directors, officers, employees, and other designated individuals, which is designed to promote compliance with all applicable insider trading laws, rules and regulations. A copy of this policy is filed as Exhibit 19.1 to this Form 10-K.
Item 11. Executive Compensation.
Information required by this Item 11 is included under the headings “Board Committees and Membership – People and Compensation Committee,” “Compensation of Non-Employee Directors,” “Compensation Discussion and Analysis,” “Executive Compensation Tables,” “People and Compensation Committee Report for the Year Ended December 31, 2024” and “CEO Pay Ratio” in our 2025 Proxy Statement. All of this information is incorporated by reference into this Annual Report.
Item 12. Security Ownership of Certain Beneficial Owners and Management and Related Stockholder Matters.
The number of shares to be issued upon exercise or vesting of grants issued under, and the number of shares remaining available for future issuance under, our equity compensation plans at December 31, 2024 were:
Equity Compensation Plan Information
Number of Securities to be Issued Upon Exercise of Outstanding Options, Warrants and Rights (1) | Weighted Average Exercise Price of Outstanding Options, Warrants and Rights (2) | Number of Securities Remaining Available for Future Issuance under Equity Compensation Plans (excluding securities reflected in column (a)) (3) | |||||||||||||||
| (a) | (b) | (c) | |||||||||||||||
| Equity compensation plans approved by security holders | 21,015,743 | $54.51 | 50,900,000 | ||||||||||||||
(1)Includes outstanding options, deferred stock units and performance share units and excludes restricted stock.
(2)Weighted average exercise price of outstanding options only.
(3)Shares available for grant under our Amended and Restated 2005 Performance Incentive Plan.
Information related to the security ownership of certain beneficial owners and management is included in our 2025 Proxy Statement under the heading “Ownership of Equity Securities” and is incorporated by reference into this Annual Report.
Item 13. Certain Relationships and Related Transactions, and Director Independence.
Information required by this Item 13 is included under the headings “Corporate Governance – Director Independence” and “Corporate Governance – Review of Transactions with Related Persons” in our 2025 Proxy Statement. All of this information is incorporated by reference into this Annual Report.
Item 14. Principal Accountant Fees and Services.
Information required by this Item 14 is included under the heading “Board Committees and Membership – Audit Committee” in our 2025 Proxy Statement. All of this information is incorporated by reference into this Annual Report.
122 | | |||||||
PART IV
Item 15. Exhibits and Financial Statement Schedules.
(a)Index to Consolidated Financial Statements and Schedules
Report of Independent Registered Public Accounting Firm (PCAOB ID | |||||
Schedules other than those listed above have been omitted either because such schedules are not required or are not applicable.
(b)The following exhibits are filed as part of, or incorporated by reference into, this Annual Report:
| 2.1 | ||||||||
| 2.2 | ||||||||
| 2.3 | ||||||||
| 2.4 | ||||||||
| 3.1 | ||||||||
| 3.2 | ||||||||
| 4.1 | ||||||||
| 4.2 | The Registrant agrees to furnish to the SEC upon request copies of any instruments defining the rights of holders of long-term debt of the Registrant and its consolidated subsidiaries that does not exceed 10 percent of the total assets of the Registrant and its consolidated subsidiaries. | |||||||
| 4.3 | ||||||||
| 4.4 | ||||||||
| 4.5 | ||||||||
| 4.6 | ||||||||
| 4.7 | ||||||||
123 | | |||||||
124 | | |||||||
| 10.13 | ||||||||
| 10.14 | ||||||||
| 10.15 | ||||||||
| 10.16 | ||||||||
| 10.17 | ||||||||
| 10.18 | ||||||||
| 10.19 | ||||||||
| 10.20 | ||||||||
| 10.21 | ||||||||
| 10.22 | ||||||||
| 10.23 | ||||||||
| 10.24 | ||||||||
| 10.25 | ||||||||
| 10.26 | ||||||||
| 10.27 | ||||||||
| 10.28 | ||||||||
| 10.29 | ||||||||
| 10.30 | ||||||||
| 10.31 | ||||||||
| 10.32 | ||||||||
| 10.33 | ||||||||
125 | | |||||||
| 10.34 | ||||||||
| 10.35 | ||||||||
| 10.36 | ||||||||
| 10.37 | ||||||||
| 10.38 | ||||||||
| 10.39 | ||||||||
| 10.40 | ||||||||
| 10.41 | ||||||||
| 10.42 | ||||||||
| 10.43 | ||||||||
| 19.1 | ||||||||
| 21.1 | ||||||||
| 23.1 | ||||||||
| 31.1 | ||||||||
| 31.2 | ||||||||
| 32.1 | ||||||||
| 97.1 | ||||||||
| 97.2 | ||||||||
| 101 | The following materials from Mondelēz International’s Annual Report on Form 10-K for the fiscal year ended December 31, 2024, formatted in iXBRL (Inline eXtensible Business Reporting Language): (i) the Consolidated Statements of Earnings, (ii) the Consolidated Statements of Comprehensive Earnings, (iii) the Consolidated Balance Sheets, (iv) the Consolidated Statements of Equity, (v) the Consolidated Statements of Cash Flows and (vi) Notes to Consolidated Financial Statements. | |||||||
| 104 | The cover page from Mondelēz International’s Annual Report on Form 10-K for the fiscal year ended December 31, 2024, formatted in Inline XBRL (included as Exhibit 101). | |||||||
| * | Portions of this exhibit (indicated by asterisks) have been omitted pursuant to a request for confidential treatment and have been separately filed with the SEC. | ||||||||||
| + | Indicates a management contract or compensatory plan or arrangement. | ||||||||||
126 | | |||||||
Item 16. Form 10-K Summary.
None.
127 | | |||||||
SIGNATURES
Pursuant to the requirements of Section 13 or 15(d) of the Securities Exchange Act of 1934, the registrant has duly caused this report to be signed on its behalf by the undersigned, thereunto duly authorized.
| MONDELĒZ INTERNATIONAL, INC. | ||||||||
| By: | /s/ LUCA ZARAMELLA | |||||||
| Luca Zaramella | ||||||||
| Executive Vice President | ||||||||
| and Chief Financial Officer | ||||||||
| (Duly Authorized Officer) | ||||||||
Date: February 5, 2025
Pursuant to the requirements of the Securities Exchange Act of 1934, this report has been signed below by the following persons on behalf of the registrant and in the capacities and on the dates indicated:
| Signature | Title | Date | ||||||||||||
| /s/ DIRK VAN DE PUT | Director, Chair and Chief Executive Officer | February 5, 2025 | ||||||||||||
| (Dirk Van de Put) | ||||||||||||||
| /s/ LUCA ZARAMELLA | Executive Vice President and Chief Financial Officer | February 5, 2025 | ||||||||||||
| (Luca Zaramella) | ||||||||||||||
| /s/ MICHAEL CALL | Senior Vice President, Corporate Controller and Chief Accounting Officer | February 5, 2025 | ||||||||||||
| (Michael Call) | ||||||||||||||
/s/ CEES ‘t HART | Director | February 5, 2025 | ||||||||||||
(Cees ‘t Hart) | ||||||||||||||
| /s/ CHARLES E. BUNCH | Director | February 5, 2025 | ||||||||||||
| (Charles E. Bunch) | ||||||||||||||
| /s/ ERTHARIN COUSIN | Director | February 5, 2025 | ||||||||||||
| (Ertharin Cousin) | ||||||||||||||
/s/ BRIAN MCNAMARA | Director | February 5, 2025 | ||||||||||||
(Brian McNamara) | ||||||||||||||
| /s/ JORGE S. MESQUITA | Director | February 5, 2025 | ||||||||||||
| (Jorge S. Mesquita) | ||||||||||||||
| /s/ ANINDITA MUKHERJEE | Director | February 5, 2025 | ||||||||||||
| (Anindita Mukherjee) | ||||||||||||||
| /s/ JANE HAMILTON NIELSEN | Director | February 5, 2025 | ||||||||||||
| (Jane Hamilton Nielsen) | ||||||||||||||
/s/ PAULA A. PRICE | Director | February 5, 2025 | ||||||||||||
(Paula A. Price) | ||||||||||||||
| /s/ PATRICK T. SIEWERT | Director | February 5, 2025 | ||||||||||||
| (Patrick T. Siewert) | ||||||||||||||
| /s/ MICHAEL A. TODMAN | Director | February 5, 2025 | ||||||||||||
| (Michael A. Todman) | ||||||||||||||
128 | | |||||||
Exhibit 10.25
SECOND AMENDMENT TO THE
MONDELĒZ GLOBAL LLC SUPPLEMENTAL BENEFITS PLAN I
WHEREAS, Mondelēz Global LLC (the “Company”) previously adopted the Mondelēz Global LLC Supplemental Benefits Plan I effective as of September 1, 2012, and amended once since then (the “Plan”); and
WHEREAS, the Company and the Management Committee for Employee Benefits (the “MCEB”) may amend and terminate the Plan pursuant to Section 7.1 thereof; and
WHEREAS, the MCEB has approved the termination of the defined benefit arrangement under the Plan effective December 1, 2024; and
WHEREAS, the MCEB previously delegated certain amendment authority with respect to the Plan to the Company’s North America Benefits and Global Wellbeing Lead (the “Delegatee”); and
WHEREAS, the Delegatee desires to amend the Plan to confirm the treatment of the defined benefit portion of the Plan as a separate nonqualified deferred compensation plan or arrangement under Section 409A of the Code and make certain changes to reflect the termination of such portion of the Plan.
NOW, THEREFORE, BE IT RESOLVED, effective as of December 1, 2024, the Plan is hereby amended as follows:
1.Section 1.1 the Plan, “History, Purpose and Effective Date” is amended to add the following to the end thereof:
Notwithstanding anything herein to the contrary, effective as of December 1, 2024, the portion of the Plan that reflects the defined benefit arrangement hereunder shall be terminated and all benefits related thereto shall be distributed in accordance with the requirements of Code Section 409A and guidance issued thereunder.
2. Section 1.2 of the Plan, “Separate Programs,” is amended to add the following to the end thereof:
Notwithstanding anything herein to the contrary, the defined contribution arrangement and defined benefit arrangement under the Plan shall be considered separate nonqualified deferred compensation plans (as defined in Treasury Regulation 1.409A-1(a)) for purposes of Code Section 409A. The defined benefit arrangement is terminated as of December 1, 2024. All benefits under the defined benefit arrangement shall be paid in accordance with Code Section 409A and all applicable guidance thereunder.
For an abundance of clarity, any benefits provided hereunder to a Former Cadbury Employee whose benefit is based on the cash balance formula under the Mondelēz Global LLC Retirement Savings Plan shall be considered a defined contribution benefit and continue to be maintained under the Plan as part of the defined contribution arrangement. For purposes of crediting interest on such accounts on and after December 1, 2024, the annual interest rate shall be fixed at 5.40%.
[Signature on the Following Page]
2
IN WITNESS WHEREOF, the Delegatee has caused this Second Amendment to be executed this 26th day of November, 2024.
MONDELĒZ GLOBAL LLC | ||
By: /s/ Cindy Friman | ||
Name: Cindy Friman | ||
Title: North American Benefits and Global Wellbeing Lead | ||
3
Exhibit 10.28
SECOND AMENDMENT TO THE
MONDELĒZ GLOBAL LLC SUPPLEMENTAL BENEFITS PLAN II
WHEREAS, Mondelēz Global LLC (the “Company”) previously adopted the Mondelēz Global LLC Supplemental Benefits Plan II effective as of September 1, 2012, and amended once since then (the “Plan”); and
WHEREAS, the Company and the Management Committee for Employee Benefits (the “MCEB”) may amend and terminate the Plan pursuant to Section 7.1 thereof; and
WHEREAS, the MCEB has approved the termination of the defined benefit arrangement under the Plan effective December 1, 2024; and
WHEREAS, the MCEB previously delegated certain amendment authority with respect to the Plan to the Company’s North America Benefits and Global Wellbeing Lead (the “Delegatee”); and
WHEREAS, the Delegatee desires to amend the Plan to confirm the treatment of the defined benefit portion of the Plan as a separate nonqualified deferred compensation plan or arrangement under Section 409A of the Code and make certain changes to reflect the termination of such portion of the Plan.
NOW, THEREFORE, BE IT RESOLVED, effective as of December 1, 2024, the Plan is hereby amended as follows:
1.Section 1.1 the Plan, “History, Purpose and Effective Date” is amended to add the following to the end thereof:
Notwithstanding anything herein to the contrary, effective as of December 1, 2024, the portion of the Plan that reflects the defined benefit arrangement hereunder shall be terminated and all benefits related thereto shall be distributed in accordance with the requirements of Code Section 409A and guidance issued thereunder.
2. Section 1.12 of the Plan, “Separate Programs,” is amended to add the following to the end thereof:
Notwithstanding anything herein to the contrary, the defined contribution arrangement and defined benefit arrangement under the Plan shall be considered separate nonqualified deferred compensation plans (as defined in Treasury Regulation 1.409A-1(a)) for purposes of Code Section 409A. The defined benefit arrangement is terminated as of December 1, 2024. All benefits under the defined benefit arrangement shall be paid in accordance with Code Section 409A and all applicable guidance thereunder.
For an abundance of clarity, any benefits provided hereunder to a Former Cadbury Employee whose benefit is based on the cash balance formula under the Mondelēz Global LLC Retirement Savings Plan shall be considered a defined contribution benefit and continue to be maintained under the Plan as part of the defined contribution arrangement. For purposes of crediting interest on such accounts on and after December 1, 2024, the annual interest rate shall be fixed at 5.40%.
[Signature on the Following Page]
2
IN WITNESS WHEREOF, the Delegatee has caused this Second Amendment to be executed this 26th day of November, 2024.
MONDELĒZ GLOBAL LLC | ||
By: /s/ Cindy Friman | ||
Name: Cindy Friman | ||
Title: North American Benefits and Global Wellbeing Lead | ||
M
3
Exhibit 10.41

Mondelēz International Inc.
Chicago, IL 60607 USA
mondelezinternational.com
PRIVATE AND CONFIDENTIAL
Ms. Stephanie Lilak
November 30, 2023
OFFER LETTER
Dear Stephanie,
I am very pleased to provide you with this offer letter setting forth the terms of your offer of employment (“Offer Letter”). It confirms the verbal offer previously extended to you for the position of EVP & Chief People Officer, Mondelēz International, Inc. (the “Company”) reporting to Dirk Van de Put, Chairman and CEO. Your principal office will be located in our Fulton Market-Chicago, Illinois office. Your employment commencement date will be as soon as mutually agreed.
Your annualized target compensation opportunity will be as follows:
Annualized Compensation (Target Opportunity)
Annual Base Salary $675,000
Annual Incentive Plan (Target - 90%*) $607,500
Target Annual Long-Term Incentive Range** $1,200,000 - $1,500,000 - $800,000
Total Target Compensation Opportunity $2,482,500 - $2,782,500 - $3,082,500
Your Annual Base Salary will be subject to an annual review by the Board and adjustment in the Board’s sole discretion. The next annual review will be in 2025.
* Target as a percent of Annual Base Salary.
** The value of the long-term incentive grants reflects the range (i.e., minimum, midpoint and maximum) for the target value of your annual equity grants. The actual number of shares, units, or options will be determined pursuant to the Company’s specific valuation methodology (e.g., Black-Scholes value for stock options).
1
Mondelēz International Internal
Exhibit 10.41
Mondelēz International Inc.
Chicago, IL 60607 USA
mondelezinternational.com
Annual Incentive Plan
You will be eligible to participate in the Mondelēz International Management Incentive Plan (the “MIP”), the Company’s annual incentive program. Your target award opportunity under the MIP is equal to 90% of your Annual Base Salary. The actual amount you receive may be lower or higher, depending on the Company’s overall financial and strategic performance during the year. The maximum award under this program for 2024 is 200% of your target opportunity. The Company reserves the right to change the maximum award annually.
You will be eligible for the 2024 MIP plan year ending on December 31, 2024. Your actual award will be determined based on the Company’s actual overall financial and strategic performance for the full 2024 plan year.
Long-Term Incentives (Annual Equity Program)
You will be eligible to fully participate in the Company’s annual equity program. Equity grants are typically made annually in February. For 2024, you will receive a $1,500,000 equity grant, 75% of the grant value will be in performance share units (“PSUs”) and 25% of the grant value will be in stock options (with the actual number of shares, units, or options based on the closing stock price on date of grant). These performance share units and stock options will be subject to the terms and conditions set forth in the Plan and the Company’s standard Global Long-Term Incentive Agreements as in effect on the date hereof.
All equity grants are subject to the terms and conditions of the Company’s Amended and Restated 2005 Performance Incentive Plan (“Plan”) and the applicable annual grant agreements. The annual equity program described above is based on our current design and the Company reserves the right to change the annual equity program at any time.
Sign-On Awards
As part of your offer of employment, you will receive:
•Sign-on cash awards with a value of $1,500,000 awarded as follows:
a.$350,000 – payable within 30 days of your hire date (subject to a two-year repayment)
b.$900,000 – payable within 8 months of your hire date
c.$250,000 – payable within 30 days of your one-year anniversary date (subject to a two-year repayment)
•Sign-on equity grants with a value of $1,500,000. The equity grants will be awarded as follows:
a.$100,000 – You will be granted performance share units (“PSUs”) under our 2022-2024 performance cycle. The number of units granted will be based on the closing stock price on the first trading day of the quarter following your date of hire.This award is scheduled
2
Mondelēz International Internal
Exhibit 10.41
Mondelēz International Inc.
Chicago, IL 60607 USA
mondelezinternational.com
to vest no later than March 1, 2025, with the performance period ending December 31, 2024,
b.$300,000 – You will be granted PSUs under our 2023-2025 performance cycle. The number of units granted will be based on the first trading day of the quarter following your date of hire. This award will vest no later than March 1, 2026, with the performance period ending December 31, 2025.
c.$1,100,000 – You will be granted Deferred Stock Units (“DSUs”) on the first trading day of the quarter following your date of hire. The number of units granted based on the closing stock price on the grant date. This award will vest 50% on the first anniversary of your grant date and 50% on the second anniversary of your grant date. You will receive dividend equivalents on these units during the vesting period for as long as the award is outstanding.
Executive Deferred Compensation Plan
You will be eligible to participate in the Executive Deferred Compensation Plan. This program allows you to voluntarily defer a portion of your salary and/or your annual incentive award to a future date. Additional information about this program is available upon request.
Severance; Change in Control Plan
From your date of hire, you will be a participant in the Mondelēz International, Inc. Change in Control Plan for Key Executives (the “CIC Plan”). The CIC Plan provides certain benefits upon an involuntary termination without Cause or voluntary termination for Good Reason following a Change in Control. A copy of the CIC Plan will be separately provided.
For purposes of this Offer Letter:
•“Cause” has the meaning set forth in the CIC Plan.
•“Good Reason” has the meaning set forth in the CIC Plan.
Stock Ownership Guidelines
You will be required to attain and hold Company stock equal in value to four (4) times your annual base salary established at your date of hire. Under current guidelines, you will have five years from your date of hire to achieve this level of ownership. Stock held for ownership determination includes common stock held directly or indirectly and unvested deferred stock units. It does not include stock options or unvested performance share units. The Company reserves the right to change the guidelines at any time.
3
Mondelēz International Internal
Exhibit 10.41
Mondelēz International Inc.
Chicago, IL 60607 USA
mondelezinternational.com
You will also be required to hold for a period of at least one year the “net” shares received upon vesting in the case of deferred stock units or performance share units or exercise in the case of stock options, from the respective vesting or exercise dates.
Net shares are the number of shares resulting from the vesting of deferred stock units or performance share units or the exercise of stock options reduced by the number of shares required to satisfy any applicable tax withholding or costs associated with respective vesting or exercise.
Other Benefits
If your employment with the Company ends due to an involuntary termination other than for Cause (as defined above), you will receive severance arrangements no less favorable than those accorded recently terminated senior executives of the Company. For the avoidance of doubt, “senior executives” as referenced in this section shall exclude legacy Cadbury executives.
Under the current policies in place, which are subject to change, you will be eligible for the Company’s discretionary financial planning program, which reimburses you up to $7,500 per year for eligible financial planning expenses, and car allowance program, which provides a car allowance of up to $15,000 per year.
You will be eligible for Mondelēz Global LLC’s comprehensive benefits package available to full-time salaried U.S. employees. You will be eligible for 30 days of paid time off annually. Details and terms of these comprehensive benefits will be provided separately.
Restrictive Covenants
As a condition to this offer of employment and corresponding consideration, you agree to the terms and conditions of the Confidential Information, Intellectual Property and Restrictive Covenants Agreement (the “Covenant Agreement”) attached hereto as Appendix A and will acknowledge such Covenant Agreement by signing the Covenant Agreement simultaneously with this offer of employment.
Section 409A of the Internal Revenue Code of 1986, as amended (the “Code”)
No amount hereunder or under any other agreement that is subject to Code Section 409A (“Section 409A”) shall be payable upon a termination of your employment unless such termination constitutes a “separation from service” with the Company under Section 409A. To the maximum extent permitted by applicable law, amounts payable to you pursuant to this Offer Letter shall be made in reliance upon the exception for certain involuntary terminations under a separation pay plan or as short-term deferral under Section 409A. For purposes of Section 409A, your right to receive any installment payments shall be treated as a right to receive a series of separate and distinct payments. To the extent any amount payable to you is subject to your entering into a release of claims with the Company and any such amount is a deferral of compensation under Section 409A and which amount could be payable to you in either of two taxable years, such payments shall be made or commence, as applicable, on the first
4
Mondelēz International Internal
Exhibit 10.41
Mondelēz International Inc.
Chicago, IL 60607 USA
mondelezinternational.com
date otherwise payable but in the later such taxable year and shall include all payments that otherwise would have been made before such date.
If you are a “specified employee” (within the meaning of Section 409A) as of your separation from service (within the meaning of Section 409A): (a) payment of any amounts under this Offer Letter (or under any severance arrangement pursuant to this Offer Letter) which the Company determines constitute the payment of nonqualified deferred compensation (within the meaning of Section 409A) and which would otherwise be paid upon your separation from service shall not be paid before the date that is six months after the date of your separation from service and any amounts that cannot be paid by reason of this limitation shall be accumulated and paid on the earlier of (x) your death and (y) the first day of the seventh month (or as soon as administratively possible thereafter) following the date of your separation from service (within the meaning of Section 409A); and (b) any welfare or other benefits (including under a severance arrangement) which the Company determines constitute the payment of nonqualified deferred compensation (within the meaning of Section 409A) and which would otherwise be provided upon your separation from service shall be provided at your sole cost during the first six- month period after your separation from service and, on the first day of the seventh month following your separation from service (or as soon as administratively possible), the Company shall reimburse you for the portion of such costs that would have been payable by the Company for that period if you were not a specified employee.
Payment of any reimbursement amounts and the provision of benefits by the Company pursuant to this Offer Letter (including any reimbursements or benefits to be provided pursuant to a severance arrangement) which the Company determines constitute nonqualified deferred compensation (within the meaning of Section 409A) shall be subject to the following:
(i)the amount of the expenses eligible for reimbursement or the in-kind benefits provided during any calendar year shall not affect the amount of the expenses eligible for reimbursement or the in-kind benefits to be provided in any other calendar year;
(ii)the reimbursement of an eligible expense will be made on or before the last day of the calendar year following the calendar year in which the expense was incurred; and
(iii)your right to reimbursement or in-kind benefits is not subject to liquidation or exchange for any other benefit.
The parties hereto intend that all compensation, benefits and other payments made to you hereunder will be provided or paid to you in compliance with all applicable provisions, or an exemption or exception from the applicable provisions of Section 409A and the regulations and rulings issued thereunder, and the rulings, notices and other guidance issued by the Internal Revenue Service interpreting the same, and this Offer Letter shall be construed and administered in accordance with such intent. The parties also agree that this Offer Letter may be modified, as reasonably agreed by the parties, to the extent necessary to comply with all applicable requirements of, and to avoid the imposition of additional tax, interest and penalties under Section 409A in connection with the compensation, benefits and other payments to be provided or paid to you hereunder. Any such modification shall maintain the original intent and benefit to the Company and you of the applicable provision of this Offer Letter, to the maximum extent possible without violating Section 409A.
5
Mondelēz International Internal
Exhibit 10.41
Mondelēz International Inc.
Chicago, IL 60607 USA
mondelezinternational.com
Other Terms and Conditions
You will be a U.S. employee of Mondelēz Global LLC and your employment status will be governed by and shall be construed in accordance with the laws of the United States. As such, your status will be that of an “at will” employee. This means that either you or Company is free to terminate the employment relationship at that time, for any reason, subject to your entitlements pursuant to this Offer Letter or any other plan or agreement applicable to a termination of your employment.
This offer is contingent upon successful completion of our pre-employment checks. These include:
1.a background check. The background screen is an investigative consumer report. Under the Fair Credit Reporting Act, you have the right to make a written request for information about the nature and scope of this report. If you wish to make such a request, you may direct your letter to my attention. You are also entitled to receive a written summary of your rights under the Fair Credit Reporting Act.
2.post-offer drug screen via current Company protocols and
3.proof of eligibility to work in the United States.
6
Mondelēz International Internal
Exhibit 10.41
Mondelēz International Inc.
Chicago, IL 60607 USA
mondelezinternational.com
If you accept our offer, please sign below and return the signed letter to my attention at vik.malhotra@mdlz.com. Once your date of hire is established, you will be provided information about the arrangements for your post offer drug screen and the required documents for verifying your eligibility to work in the United States.
Should you have any questions concerning this information, please contact me.
| /s/ Vik Malhotra | 11/30/2023 | |||||||
SVP Total Rewards & Performance Mondelēz Global LLC | Date | |||||||
I have read the above terms and conditions and, by signing below, do accept this offer. This letter does not, in any way, constitute an express or implied contract for employment.
| /s/ Stephanie Lilak | 11/30/2023 | |||||||
| Stephanie Lilak | Date | |||||||
[Signature Page to Ms. Stephanie Lilak Offer Letter]
7
Mondelēz International Internal


| Exhibit 21.1 | |||||
| Mondelēz International, Inc. | |||||
| Subsidiaries List – December 31, 2024 | |||||
| LU Algerie S.p.A. | Algeria | ||||
| Mondelez Argentina S.A. | Argentina | ||||
| Van Mar SA | Argentina | ||||
| Nabisco Inversiones S.R.L. | Argentina | ||||
| Cadbury Marketing Services Pty Ltd | Australia | ||||
| Fine Food Holdings Pty Ltd | Australia | ||||
| Gourmet Food Holdings Pty Ltd | Australia | ||||
| Gourmet Food Operations Pty Ltd | Australia | ||||
| KF (Australia) Pty Ltd | Australia | ||||
| Mondelez Australia (Foods) Ltd | Australia | ||||
| Mondelez Australia Group Co Pty Ltd | Australia | ||||
| Mondelez Australia Group Investments Limited Partnership | Australia | ||||
| Mondelez Australia Holdings Pty Ltd | Australia | ||||
| Mondelez Australia Pty Ltd | Australia | ||||
| MONDELEZ GF HOLDING COMPANY PTY LTD | Australia | ||||
| Mondelez New Zealand Holdings (Australia) Pty Ltd | Australia | ||||
| Mirabell Salzburger Confiserie-und Bisquit GmbH | Austria | ||||
| Mondelez Österreich GmbH | Austria | ||||
| Mondelez Österreich Production GmbH | Austria | ||||
| Mondelez Bahrain Biscuits W.L.L. | Bahrain | ||||
| Mondelez Bangladesh Private Limited | Bangladesh | ||||
| Mondelez Belgium Chocolate Production BV | Belgium | ||||
| Mondelez Namur Production SRL | Belgium | ||||
| Confibel SRL | Belgium | ||||
| Kraft Foods Belgium Intellectual Property BV | Belgium | ||||
| Mondelez Belgium Biscuits Production NV | Belgium | ||||
| Mondelez Belgium BV | Belgium | ||||
| Mondelez Belgium Manufacturing Services BV | Belgium | ||||
| Mondelez Belgium Services BV | Belgium | ||||
| Mondelez de Alimentos Bolivia S.R.L | Bolivia | ||||
| Cadbury Botswana (Proprietary) Limited | Botswana | ||||
| Mondelez Brasil Ltda | Brazil | ||||
| Mondelez Brasil Norte Nordeste Ltda | Brazil | ||||
| Chipita Bulgaria EAD | Bulgaria | ||||
| Mondelez Bulgaria Holding AD | Bulgaria | ||||
| Mondelez Bulgaria OOD | Bulgaria | ||||
| Mondelez Bulgaria Production OOD | Bulgaria | ||||
| Give and Go Prepared Foods Corp. | Canada | ||||
| MCI Finance Inc. | Canada | ||||
| Mondelez Asia Pacific (Alberta) GP ULC | Canada | ||||
| Mondelez Canada Holdings ULC | Canada | ||||
| Mondelez Canada Inc. | Canada | ||||
| TCI Realty Holdings Inc. | Canada | ||||
| Mondelez Chile S.A. | Chile | ||||
| Cadbury Confectionery (Guangzhou) Co., Limited | China | ||||
| Mondelez Shanghai Food Corporate Management Co., Ltd. | China | ||||
| Mondelez Suzhou Food Co.Ltd | China | ||||
| Mondelez Beijing Food Co., Ltd | China | ||||
| Mondelez China Co., Ltd | China | ||||
| Nabisco Food (Suzhou) Co. Ltd. | China | ||||
| EVIRTH (Shanghai) lndustrial Co., Ltd. | China | ||||
| EVIRTH (Dongguan) Food Co., Ltd. | China | ||||
| EVIRTH (Shanghai) Biotechnology Co., Ltd. | China | ||||
| EVIRTH (Shanghai) Food Co., Ltd. | China | ||||
| EVIRTH (Shanghai) Supply Chain Management Co., Ltd. | China | ||||
| EVIRTH (Shenzhen) Food Co., Ltd. | China | ||||
| Mondelez Colombia S.A.S. | Colombia | ||||
| Servicios Comerciales Colombia S.A.S. | Colombia | ||||
| 3-101-138869, S.A. | Costa Rica | ||||
| Mondelez Business Services Costa Rica Limitada | Costa Rica | ||||
| Mondelez Costa Rica Limitada | Costa Rica | ||||
| Mondelez Zagreb d.o.o. | Croatia | ||||
| Mondelez CR Biscuit Production s.r.o. | Czech Republic | ||||
| Mondelez Czech Republic s.r.o. | Czech Republic | ||||
| Opavia - LU, s.r.o. | Czech Republic | ||||
| Kraft Foods Danmark Intellectual Property ApS | Denmark | ||||
| Mondelez Danmark ApS | Denmark | ||||
| Mondelez Dominicana, S.A. | Dominican Republic | ||||
| Mondelez Ecuador C Ltda. | Ecuador | ||||
| Mondelez Egypt Foods S.A.E. | Egypt | ||||
| Mondelez Egypt Trading S.A.E | Egypt | ||||
| Mondelez El Salvador, Ltda. de C.V. | El Salvador | ||||
| Mondelez Eesti Osauhing | Estonia | ||||
| Chapelat Swaziland (Proprietary) Limited | Eswatini | ||||
| Mondelez Finland Oy | Finland | ||||
| Generale Biscuit | France | ||||
| Generale Biscuit Glico France | France | ||||
| Kraft Foods France Biscuit S.A.S. | France | ||||
| Mondelez France Antilles Guyane Distribution SAS | France | ||||
| Mondelez France Biscuit Distribution SAS | France | ||||
| Mondelez France Biscuits Production SAS | France | ||||
| Mondelez France Company SAS | France | ||||
| Mondelez France Océan Indien Distribution SAS | France | ||||
| Mondelez France R&D SAS | France | ||||
| Mondelez France SAS | France | ||||
| LLC Mondelez Georgia | Georgia | ||||
| Carlton Lebensmittelvertriebs GmbH | Germany | ||||
| Kraft Foods Deutschland Biscuits Grundstuecksverwaltungs GmbH & Co. KG | Germany | ||||
| Kraft Foods Deutschland Holding Grundstuecksverwaltungs GmbH & Co. KG | Germany | ||||
| Kraft Foods Deutschland Production Grundstuecksverwaltungs GmbH & Co. KG | Germany | ||||
| Mondelez Deutschland Biscuits Production GmbH | Germany | ||||
| Mondelez Deutschland GmbH | Germany | ||||
| Mondelez Deutschland Services GmbH & Co. KG | Germany | ||||
| Mondelez Deutschland Snacks Production GmbH & Co. KG | Germany | ||||
| Suchard GmbH | Germany | ||||
| Cadbury Ghana Limited | Ghana | ||||
| Mondelez Hellas Production S.A. | Greece | ||||
| Mondelez Hellas S.A. | Greece | ||||
| Mondelez Hellas Snacks Production Single Member S.A. | Greece | ||||
| Mondelez Guatemala Limitada | Guatemala | ||||
| Mondelez Honduras, S. de R.L. | Honduras | ||||
| Mondelez Hong Kong Limited | Hong Kong | ||||
| EVIRTH (Hong Kong) Industry Co., Ltd. | Hong Kong | ||||
| Symphony Hong Kong Investment Ltd. | Hong Kong | ||||
| Gyori Keksz Kft | Hungary | ||||
| Mondelez Hungária IP Kft. | Hungary | ||||
| Mondelez Hungária Kft. | Hungary | ||||
| C S Business Services (India) Private Limited (CSBS) | India | ||||
| Induri Farm Private Limited | India | ||||
| Mondelez India Foods Private Limited | India | ||||
| PT Kraft Ultrajaya Indonesia | Indonesia | ||||
| PT. Cadbury Indonesia | Indonesia | ||||
| PT. Mondelez Indonesia | Indonesia | ||||
| PT. Cipta ManisMakmur | Indonesia | ||||
| PT Mondelez Indonesia Trading | Indonesia | ||||
| PT Mondelez Indonesia Manufacturing | Indonesia | ||||
| Berkeley Re Designed Activity Company | Ireland | ||||
| Cadbury Schweppes Ireland Limited | Ireland | ||||
| Kraft Foods Ireland Intellectual Property Limited | Ireland | ||||
| Mondelez Ireland Insurance Holdings Limited | Ireland | ||||
| Mondelez Ireland Limited | Ireland | ||||
| Mondelez Ireland Production Limited | Ireland | ||||
| Fattorie Osella S.p.A. | Italy | ||||
| HUP S.r.l. | Italy | ||||
| Kraft Foods Italia Intellectual Property S.r.l. | Italy | ||||
| Mondelez Italia Biscuits Production S.p.A. | Italy | ||||
| Mondelez Italia S.r.l. | Italy | ||||
| Mondelez Italia Services S.r.l. | Italy | ||||
| MONDELEZ COTE D'IVORE S.A.R.L. | Ivory Coast | ||||
| Meito Adams Company Limited | Japan | ||||
| Mondelez Japan Limited | Japan | ||||
| Mondelez Kazakhstan LLP | Kazakhstan | ||||
| Cadbury Kenya Limited | Kenya | ||||
| Dong Suh Foods Corporation | Korea, Republic of | ||||
| Migabang Limited Company | Korea, Republic of | ||||
| Sam Kwang Glass Co., Ltd | Korea, Republic of | ||||
| Mondelez Latvija SIA | Latvia | ||||
| Cadbury Adams Middle East S.A.L. | Lebanon | ||||
| UAB Mondelez Baltic | Lithuania | ||||
| UAB Mondelez Lietuva Production | Lithuania | ||||
| Cadbury Confectionery Sales (M) Sdn. Bhd. | Malaysia | ||||
| Mondelez Malaysia Sales Sdn. Bhd. | Malaysia | ||||
| Mondelez Malaysia Sdn. Bhd. | Malaysia | ||||
| Cadbury Confectionery Malaysia Sdn. Bhd. | Malaysia | ||||
| Cadbury Mauritius Ltd. | Mauritius | ||||
| Mondelez Mexico, S. de R.L. de C.V. | Mexico | ||||
| Productos Mondelez, S. de R.L. de C.V. | Mexico | ||||
| Ricolino, S.A. de C.V. | Mexico | ||||
| Mondelez Maroc | Morocco | ||||
| Société Immobilière Ibrahim d'Ain Sebaa S.A.R.L | Morocco | ||||
| AztecAgri B.V. | Netherlands | ||||
| Cadbury Holdings B.V. | Netherlands | ||||
| Cadbury Netherlands International Holdings B.V. | Netherlands | ||||
| Grenade B.V. | Netherlands | ||||
| Kraft Foods Cesko Holdings B.V. | Netherlands | ||||
| Kraft Foods LA MB Holding B.V. | Netherlands | ||||
| Kraft Foods LA MC B.V. | Netherlands | ||||
| Kraft Foods LA NMB B.V. | Netherlands | ||||
| Kraft Foods LA NVA B.V. | Netherlands | ||||
| Kraft Foods LA VA Holding B.V. | Netherlands | ||||
| Kraft Foods Nederland Intellectual Property B.V. | Netherlands | ||||
| Kraft Foods North America and Asia B.V. | Netherlands | ||||
| Mondelez España Biscuits Holdings B.V. | Netherlands | ||||
| Mondelez International Holdings Netherlands B.V. | Netherlands | ||||
| Mondelez International Intercontinental Netherlands B.V. | Netherlands | ||||
| Mondelez International Nederland Biscuit B.V. | Netherlands | ||||
| Mondelez Nederland B.V. | Netherlands | ||||
| Mondelez Nederland Services B.V. | Netherlands | ||||
| Gourmet Food New Zealand Limited | New Zealand | ||||
| Mondelez New Zealand | New Zealand | ||||
| Mondelez New Zealand Investments | New Zealand | ||||
| Mondelez Nicaragua, S.A. | Nicaragua | ||||
| Cadbury Nigeria PLC | Nigeria | ||||
| Kraft Foods Norge Intellectual Property AS | Norway | ||||
| Mondelez Norge AS | Norway | ||||
| Mondelez Norge Production AS | Norway | ||||
| Mondelez Pakistan Limited | Pakistan | ||||
| Mondelez Panama S. de R.L. | Panama | ||||
| Mondelez Peru SA | Peru | ||||
| Mondelez Philippines, Inc. | Philippines | ||||
| LU Polska Sp. z o.o. | Poland | ||||
| Mondelez International RD&Q sp. z o.o. | Poland | ||||
| Mondelez Polska Production sp. z o.o. | Poland | ||||
| Mondelez Polska Sp. z o.o. | Poland | ||||
| Mondelez Portugal, Unipessoal, Lda. | Portugal | ||||
| Mondelez Puerto Rico LLC | Puerto Rico | ||||
| Mondelez Romania S.A. | Romania | ||||
| Mondelez Romania Snacks Production S.R.L | Romania | ||||
| CHIPITA SAINT-PETERSBURG LLC | Russian Federation | ||||
| Mon’delez Rus LLC | Russian Federation | ||||
| Mondelez Arabia For Trading LLC | Saudi Arabia | ||||
| Mondelez d.o.o. Beograd | Serbia | ||||
| Mondelez Procurement d.o.o. Beograd | Serbia | ||||
| Kuan Enterprises Private Limited | Singapore | ||||
| Mondelez Business Services AP Pte Ltd | Singapore | ||||
| Mondelez Helix Singapore Pte. Ltd. | Singapore | ||||
| Mondelez Holdings Singapore Pte.Ltd. | Singapore | ||||
| Mondelez International AMEA Pte. Ltd. | Singapore | ||||
| Mondelez Singapore Sales Pte Ltd | Singapore | ||||
| Mondelez Trading Singapore Pte. Ltd. | Singapore | ||||
| Symphony Singapore Investments Pte. Ltd | Singapore | ||||
| Mondelez European Business Services Centre s.r.o. | Slovakia | ||||
| Mondelez Slovakia Holding a.s. | Slovakia | ||||
| Mondelez Slovakia Intellectual Property s.r.o | Slovakia | ||||
| Mondelez Slovakia s.r.o | Slovakia | ||||
| Mondelez SR Production s.r.o. | Slovakia | ||||
| Mondelez, trgovska druzba, d.o.o., Trzin | Slovenia | ||||
| Chapelat-Humphries Investments (Pty) Limited | South Africa | ||||
| Mondelez South Africa (Pty) Ltd. | South Africa | ||||
| Chipita España SL | Spain | ||||
| Kraft Foods España Intellectual Property, S.L.U. | Spain | ||||
| Mondelez España Commercial, S.L. | Spain | ||||
| Mondelez España Galletas Production, S.L.U. | Spain | ||||
| Mondelez España Postres Production, S.A.U. | Spain | ||||
| Mondelez España Production, S.L.U. | Spain | ||||
| Mondelez España Services, S.L.U. | Spain | ||||
| Mondelez Iberia Holdings, S.L.U. | Spain | ||||
| Mondelez Iberia Snacking Holdings, S.L.U. | Spain | ||||
| Kraft Foods Sverige Holding AB | Sweden | ||||
| Kraft Foods Sverige Intellectual Property AB | Sweden | ||||
| Mondelez Sverige AB | Sweden | ||||
| Mondelez Sverige Production AB | Sweden | ||||
| Kraft Foods Schweiz Holding GmbH | Switzerland | ||||
| Mondelez Europe GmbH | Switzerland | ||||
| Mondelez Europe Procurement GmbH | Switzerland | ||||
| Mondelez Europe Services GmbH | Switzerland | ||||
| Mondelez International Finance AG | Switzerland | ||||
| Mondelez Schweiz GmbH | Switzerland | ||||
| Mondelez Schweiz Production GmbH | Switzerland | ||||
| Mondelez World Travel Retail GmbH | Switzerland | ||||
| Mondelez Taiwan Limited | Taiwan | ||||
| Mondelez (Thailand) Co., Ltd | Thailand | ||||
| Mondelez International (Thailand) Co., Ltd | Thailand | ||||
| Mondelez Turkey Gida Uretim A.S. | Turkey | ||||
| Kent Gida Maddeleri Sanayii ve Ticaret Anonim Sirketi | Turkey | ||||
| Chipita Ukraine Trading LLC | Ukraine | ||||
| LLC Chipsy LYUKS | Ukraine | ||||
| Private Joint Stock Company "Mondelez Ukraina" | Ukraine | ||||
| Mondelez Middle East & Africa FZE | United Arab Emirates | ||||
| Brentwick Limited | United Kingdom | ||||
| Cadbury Eight LLP | United Kingdom | ||||
| Cadbury Limited | United Kingdom | ||||
| Cadbury Nine LLP | United Kingdom | ||||
| Cadbury Schweppes Finance Limited | United Kingdom | ||||
| Cadbury Schweppes Overseas Limited | United Kingdom | ||||
| CADBURY SEVEN LLP | United Kingdom | ||||
| Cadbury South Africa (Holdings) | United Kingdom | ||||
| Cadbury UK Limited | United Kingdom | ||||
| Cadbury Nominees Limited | United Kingdom | ||||
| Cadbury Schweppes Investments Limited | United Kingdom | ||||
| Chromium Acquisitions Limited | United Kingdom | ||||
| Chromium Assets Limited | United Kingdom | ||||
| Chromium Suchex LLP | United Kingdom | ||||
| Craven Keiller | United Kingdom | ||||
| Ernest Jackson & Co Limited | United Kingdom | ||||
| Grenade (UK) Limited | United Kingdom | ||||
| Grenade Holdings Limited | United Kingdom | ||||
| Hu Master UK Limited | United Kingdom | ||||
| Kraft Foods Investment Holdings UK Limited | United Kingdom | ||||
| Kraft Foods UK Intellectual Property Limited | United Kingdom | ||||
| Kraft Foods UK IP & Production Holdings Limited | United Kingdom | ||||
| Mondelez International Services Limited | United Kingdom | ||||
| Mondelez UK Biscuit Financing Limited | United Kingdom | ||||
| Mondelez UK Confectionery Production Limited | United Kingdom | ||||
| Mondelez UK Finance Company Limited | United Kingdom | ||||
| Mondelez UK Holdings & Services Limited | United Kingdom | ||||
| Mondelez UK Limited | United Kingdom | ||||
| Mondelez UK R&D Limited | United Kingdom | ||||
| Reading Scientific Services Limited | United Kingdom | ||||
| Schweppes Limited | United Kingdom | ||||
| Speedy Assetco Limited | United Kingdom | ||||
| The Old Leo Company Limited | United Kingdom | ||||
| Trebor Bassett Limited | United Kingdom | ||||
| Trebor International Limited | United Kingdom | ||||
| Vantas International Limited | United Kingdom | ||||
| Hu Catering, LLC | United States | ||||
| Hu Holdings, LLC | United States | ||||
| Third 86 Partners LLC | United States | ||||
| Third Avenue 1536 Partners, LLC | United States | ||||
| Enjoy Life Natural Brands, LLC | United States | ||||
| Epta America, L.L.C. | United States | ||||
| HU Master Holdings LLC | United States | ||||
| Hu Products, LLC | United States | ||||
| Intercontinental Brands LLC | United States | ||||
| Intercontinental Great Brands LLC | United States | ||||
| KFI-USLLC IX | United States | ||||
| Kraft Foods Asia Pacific Services LLC | United States | ||||
| Kraft Foods Biscuit Brands Kuan LLC | United States | ||||
| Kraft Foods Holdings LLC | United States | ||||
| Kraft Foods International Europe Holdings LLC | United States | ||||
| Kraft Foods International Holdings Delaware LLC | United States | ||||
| Kraft Foods International Services LLC | United States | ||||
| Kraft Foods Latin America Holding LLC | United States | ||||
| Kraft Foods R & D, Inc. | United States | ||||
| Mondelez BTN Holdings LLC | United States | ||||
| Mondelez Global Direct Inc. | United States | ||||
| Mondelez Global LLC | United States | ||||
| Mondelez International Delaware LLC | United States | ||||
| Mondelez International Financing Delaware LLC | United States | ||||
| Mondelez International Holdings LLC | United States | ||||
| Mondelez International Service Holdings LLC | United States | ||||
| Perfect Bar Blocker, Inc. | United States | ||||
| SMR Concepts Inc. | United States | ||||
| Tate's Bake Shop, Inc. | United States | ||||
| Tate's Holding Company | United States | ||||
| Tate's Wholesale, LLC | United States | ||||
| Give and Go Prepared Foods (U.S.A.) Corp. | United States | ||||
| KFI-USLLC VII | United States | ||||
| KFI-USLLC VIII | United States | ||||
| KFI-USLLC XI | United States | ||||
| KFI-USLLC XIV | United States | ||||
| Mondelez International Service LLC | United States | ||||
| Perfect Bar Holdings, LLC | United States | ||||
| Perfect Bar, LLC | United States | ||||
| Productos de Leche Coronado, S.A. de C.V. | United States | ||||
| PurpleBird LLC | United States | ||||
| Mondelez Uruguay S.A. | Uruguay | ||||
| Cadbury Beverages de Venezuela CA | Venezuela | ||||
| Compañia Venezolana de Conservas CA (COVENCO) | Venezuela | ||||
| Covenco Holding C.A. | Venezuela | ||||
| Tevalca Holding C.A. | Venezuela | ||||
| Mondelez VZ, C.A. | Venezuela, Bolivarian Republic of | ||||
| Promotora Cadbury Adams, C.A. | Venezuela, Bolivarian Republic of | ||||
| Mondelez Kinh Do Viet Nam Joint Stock Company | Vietnam | ||||
| North Kinh Do One Member Company Limited | Vietnam | ||||
| Cadbury Schweppes Zimbabwe (Private) Limited | Zimbabwe | ||||
EXHIBIT 23.1
CONSENT OF INDEPENDENT REGISTERED PUBLIC ACCOUNTING FIRM
We hereby consent to the incorporation by reference in the Registration Statements on Form S-3 (No. 333-270063) and Form S-8 (Nos. 333-279637, 333-197088, 333-184178, 333-183993, 333-182066, 333-174665, 333-165736, 333-133559 and 333-125992) of Mondelēz International, Inc. of our report dated February 5, 2025 relating to the financial statements and the effectiveness of internal control over financial reporting, which appears in this Form 10-K.
/s/ PricewaterhouseCoopers LLP
Chicago, Illinois
February 5, 2025
PricewaterhouseCoopers LLP, One North Wacker, Chicago, Illinois 60606
T: 312-298-2000, F: 312-298-2001, www.pwc.com/us
EXHIBIT 31.1
Certifications
I, Dirk Van de Put, certify that:
| 1. | I have reviewed this annual report on Form 10-K of Mondelēz International, Inc.; | ||||
| 2. | Based on my knowledge, this report does not contain any untrue statement of a material fact or omit to state a material fact necessary to make the statements made, in light of the circumstances under which such statements were made, not misleading with respect to the period covered by this report; | ||||
| 3. | Based on my knowledge, the financial statements, and other financial information included in this report, fairly present in all material respects the financial condition, results of operations and cash flows of the registrant as of, and for, the periods presented in this report; | ||||
| 4. | The registrant’s other certifying officer(s) and I are responsible for establishing and maintaining disclosure controls and procedures (as defined in Exchange Act Rules 13a-15(e) and 15d-15(e)) and internal control over financial reporting (as defined in Exchange Act Rules 13a-15(f) and 15d-15(f)) for the registrant and have: | ||||
| (a) | Designed such disclosure controls and procedures, or caused such disclosure controls and procedures to be designed under our supervision, to ensure that material information relating to the registrant, including its consolidated subsidiaries, is made known to us by others within those entities, particularly during the period in which this report is being prepared; | |||||||
| (b) | Designed such internal control over financial reporting, or caused such internal control over financial reporting to be designed under our supervision, to provide reasonable assurance regarding the reliability of financial reporting and the preparation of financial statements for external purposes in accordance with generally accepted accounting principles; | |||||||
| (c) | Evaluated the effectiveness of the registrant’s disclosure controls and procedures and presented in this report our conclusions about the effectiveness of the disclosure controls and procedures, as of the end of the period covered by this report based on such evaluation; and | |||||||
| (d) | Disclosed in this report any change in the registrant’s internal control over financial reporting that occurred during the registrant’s most recent fiscal quarter (the registrant’s fourth fiscal quarter in the case of an annual report) that has materially affected, or is reasonably likely to materially affect, the registrant’s internal control over financial reporting; and | |||||||
| 5. | The registrant’s other certifying officer(s) and I have disclosed, based on our most recent evaluation of internal control over financial reporting, to the registrant’s auditors and the audit committee of the registrant’s board of directors (or persons performing the equivalent functions): | ||||
| (a) | All significant deficiencies and material weaknesses in the design or operation of internal control over financial reporting which are reasonably likely to adversely affect the registrant’s ability to record, process, summarize and report financial information; and | |||||||
| (b) | Any fraud, whether or not material, that involves management or other employees who have a significant role in the registrant’s internal control over financial reporting. | |||||||
Date: February 5, 2025
/s/ DIRK VAN DE PUT | ||
| Dirk Van de Put Chairman and Chief Executive Officer | ||
EXHIBIT 31.2
Certifications
I, Luca Zaramella, certify that:
| 1. | I have reviewed this annual report on Form 10-K of Mondelēz International, Inc.; | ||||
| 2. | Based on my knowledge, this report does not contain any untrue statement of a material fact or omit to state a material fact necessary to make the statements made, in light of the circumstances under which such statements were made, not misleading with respect to the period covered by this report; | ||||
| 3. | Based on my knowledge, the financial statements, and other financial information included in this report, fairly present in all material respects the financial condition, results of operations and cash flows of the registrant as of, and for, the periods presented in this report; | ||||
| 4. | The registrant’s other certifying officer(s) and I are responsible for establishing and maintaining disclosure controls and procedures (as defined in Exchange Act Rules 13a-15(e) and 15d-15(e)) and internal control over financial reporting (as defined in Exchange Act Rules 13a-15(f) and 15d-15(f)) for the registrant and have: | ||||
| (a) | Designed such disclosure controls and procedures, or caused such disclosure controls and procedures to be designed under our supervision, to ensure that material information relating to the registrant, including its consolidated subsidiaries, is made known to us by others within those entities, particularly during the period in which this report is being prepared; | |||||||
| (b) | Designed such internal control over financial reporting, or caused such internal control over financial reporting to be designed under our supervision, to provide reasonable assurance regarding the reliability of financial reporting and the preparation of financial statements for external purposes in accordance with generally accepted accounting principles; | |||||||
| (c) | Evaluated the effectiveness of the registrant’s disclosure controls and procedures and presented in this report our conclusions about the effectiveness of the disclosure controls and procedures, as of the end of the period covered by this report based on such evaluation; and | |||||||
| (d) | Disclosed in this report any change in the registrant’s internal control over financial reporting that occurred during the registrant’s most recent fiscal quarter (the registrant’s fourth fiscal quarter in the case of an annual report) that has materially affected, or is reasonably likely to materially affect, the registrant’s internal control over financial reporting; and | |||||||
| 5. | The registrant’s other certifying officer(s) and I have disclosed, based on our most recent evaluation of internal control over financial reporting, to the registrant’s auditors and the audit committee of the registrant’s board of directors (or persons performing the equivalent functions): | ||||
| (a) | All significant deficiencies and material weaknesses in the design or operation of internal control over financial reporting which are reasonably likely to adversely affect the registrant’s ability to record, process, summarize and report financial information; and | |||||||
| (b) | Any fraud, whether or not material, that involves management or other employees who have a significant role in the registrant’s internal control over financial reporting. | |||||||
Date: February 5, 2025
/s/ LUCA ZARAMELLA | ||
| Luca Zaramella Executive Vice President and Chief Financial Officer | ||
EXHIBIT 32.1
CERTIFICATIONS OF
CHIEF EXECUTIVE OFFICER AND CHIEF FINANCIAL OFFICER
PURSUANT TO
18 U.S.C. SECTION 1350,
AS ADOPTED PURSUANT TO
SECTION 906 OF THE SARBANES-OXLEY ACT OF 2002
I, Dirk Van de Put, Chairman and Chief Executive Officer of Mondelēz International, Inc. (“Mondelēz International”), certify, pursuant to 18 U.S.C. Section 1350, as adopted pursuant to Section 906 of the Sarbanes-Oxley Act of 2002, that Mondelēz International’s Annual Report on Form 10-K for the year ended December 31, 2024 (the "Report"), fully complies with the requirements of Section 13(a) or 15(d) of the Securities Exchange Act of 1934 and that the information contained in the Report fairly presents, in all material respects, Mondelēz International’s financial condition and results of operations.
/s/ DIRK VAN DE PUT | ||
| Dirk Van de Put | ||
| Chairman and Chief Executive Officer | ||
| February 5, 2025 | ||
I, Luca Zaramella, Executive Vice President and Chief Financial Officer of Mondelēz International, Inc. (“Mondelēz International”), certify, pursuant to 18 U.S.C. Section 1350, as adopted pursuant to Section 906 of the Sarbanes-Oxley Act of 2002, that Mondelēz International’s Annual Report on Form 10-K for the year ended December 31, 2024 (the "Report"), fully complies with the requirements of Section 13(a) or 15(d) of the Securities Exchange Act of 1934 and that the information contained in the Report fairly presents, in all material respects, Mondelēz International’s financial condition and results of operations.
/s/ LUCA ZARAMELLA | ||
| Luca Zaramella | ||
| Executive Vice President and | ||
| Chief Financial Officer | ||
| February 5, 2025 | ||
A signed original of these written statements required by Section 906, or other document authenticating, acknowledging, or otherwise adopting the signature that appears in typed form within the electronic version of this written statement required by Section 906, has been provided to Mondelēz International, Inc. and will be retained by Mondelēz International, Inc. and furnished to the Securities and Exchange Commission or its staff upon request.
Exhibit 97.1

Dated July 18, 2023
Mondelēz International, Inc.
Dodd-Frank Clawback Policy
Description
The Board of Directors (the “Board”) of Mondelēz International, Inc. (the “Company”) believes it is in the best interests of the Company and its shareholders to adopt the Dodd-Frank Clawback Policy (the “Policy”). The Policy is designed to comply with the requirements of Listing Rule 5608 adopted by the Nasdaq Stock Market (“Nasdaq”) to implement Rule 10D-1 under the Securities Exchange Act of 1934, as amended (collectively, “Rule 10D-1”). The Policy sets forth the circumstances under which the Company will recover certain incentive compensation paid to the Executive Officers (as defined below) of the Company in connection with certain financial restatements. This Policy shall be administered by the Committee (as defined below) and the Company is authorized to take appropriate steps to implement this Policy with respect to incentive compensation arrangements with its Executive Officers.
Definitions
(A)“Committee” means the People and Compensation Committee of the Board of Directors of the Company.
(B)“Covered Accounting Restatement” means an accounting restatement that the Company is required to prepare due to the material noncompliance of the Company with any financial reporting requirement under the securities laws, including any required accounting restatement to correct an error in previously issued financial statements that is material to the previously issued financial restatements (i.e., a “Big R” restatement), or that would result in a material misstatement if the error were corrected in the current period or left uncorrected in the current period (i.e., a “little r” restatement). The Committee shall take into consideration any applicable interpretations and clarifications of the Securities and Exchange Commission and Nasdaq regarding application of Rule 10D-1 in determining whether an accounting restatement qualifies as a Covered Accounting Restatement for purposes of this Policy.
(C)“Covered Incentive-Based Compensation” means any Incentive-Based Compensation (i) received by a current or former Executive Officer after beginning service as an Executive Officer, provided that the current or former Executive Officer served as an Executive Officer at any time during the performance period applicable to such Incentive-Based Compensation and (ii) received on or after October 2, 2023. For purposes of this definition, Incentive-Based Compensation is deemed to be “received” in the fiscal year in which the Financial Reporting Measure included in the Incentive-Based Compensation is attained or satisfied, regardless of whether the payment or grant occurs before or after such fiscal year.
(D)“Executive Officer” means any “executive officer” of the Company as defined under Rule 10D-1.
(E)“Financial Reporting Measure” means (i) any measure determined in accordance with accounting principles used in preparing the Company’s financial statements, whether presented within or outside of the Company’s financial statements, (ii) any measures derived wholly or in part from
Page 1 of 3
such measures (including non-GAAP measures), and (iii) stock price, total shareholder return and relative total shareholder return.
(F)"Incentive-Based Compensation” means any compensation that is granted, earned or vested based wholly or in part on the attainment of any Financial Reporting Measure, which may include, but is not limited to, awards granted under the Company’s annual incentive plan as well as performance share units. For the avoidance of doubt, Incentive-Based Compensation shall not include equity awards that are granted, earned, and vested solely based on continued service and were not based on the attainment of any Financial Reporting Measure.
General Rules
In the event the Company determines it is required to prepare a Covered Accounting Restatement, the Committee shall review any Covered Incentive-Based Compensation received by a current or former Executive Officer of the Company during the three completed fiscal years (and any transition period of less than nine months that is within or immediately following such three fiscal years) preceding the earlier of the date that (i) the Company determines, or reasonably should have determined, such a Covered Accounting Restatement is required to be prepared or (ii) a court, regulator, or other legally authorized body orders the preparation of a Covered Accounting Restatement (such period, the “Clawback Recovery Period”). In the event the Committee determines that the amount of any such Covered Incentive-Based Compensation that was received exceeds the amount that otherwise would have been received had it been determined based on the restated results (such excess, the “Erroneously Awarded Compensation”), the amount of such Erroneously Awarded Compensation shall be recovered on a pre-tax basis without any regard to taxes paid.
For purposes of this Policy, Incentive-Based Compensation is deemed to be “received” in the fiscal year in which the Financial Reporting Measure included in the Incentive-Based Compensation is attained or satisfied, regardless of whether the payment or grant occurs before or after such fiscal year.
Calculation of Erroneously Awarded Compensation
In the event any Covered Incentive-Based Compensation received during a Clawback Recovery Period has been granted in the form of equity or equity-based awards, the Erroneously Awarded Compensation shall be calculated based on the number of shares received in excess of the number that should have been received had it been determined based on the restated results (or the corresponding value of such shares), as determined in accordance with Rule 10D-1.
In the event the Erroneously Awarded Compensation is not able to be calculated directly from information in an accounting restatement (e.g., equity awards subject to total shareholder return or stock price measures), the Committee shall use a reasonable estimate to determine the amount of such Erroneously Awarded Compensation that shall be subject to recovery.
The Company will maintain and will provide to Nasdaq documentation of all determinations and actions taken in complying with this Policy, as required. Any determinations made by the Committee under this Policy shall be final and binding on all affected individuals.
Page 2 of 3
Method for Recovery
The Committee shall, in its discretion, determine the appropriate means for recovery of any Erroneously Awarded Compensation, including by reducing future compensation, the cancellation of outstanding and future annual or long-term incentive compensation, requiring repayment by the applicable Executive Officer, or such other means or combination of means as the Committee determines to be appropriate. Any such recovery shall occur on a reasonably prompt basis (as determined in accordance with Listing Rule 5608 and Rule 10D-1).
Recovery shall be required in all circumstances unless the Committee determines that recovery is impracticable and not required in accordance with any applicable exceptions under Rule 10D-1. The Company shall not indemnify any Executive Officer against the loss of any compensation pursuant to this Policy. In no event shall the Company be required to award any Executive Officer any additional payments if the Covered Accounting Restatement would have resulted in a higher incentive compensation payment.
Non-Exclusive
This Policy is in addition to any and all other rights the Company may have to pursue remedies against an employee or former employee in connection with an accounting restatement or for misconduct or similar behavior in the course of employment by the Company, all of which are expressly retained by the Company. For the avoidance of doubt, any right of recovery under this Policy is in addition to, and not in lieu of, any other remedies or rights of recovery that may be available to the Company pursuant to the terms of the Company’s Compensation Recoupment Policy, dated February 18, 2019, and any similar policy or provision in any employment agreement, equity award agreement or similar agreement or any other legal remedies available to the Company.
Amendment or Termination
The Committee may amend or terminate this Policy from time to time in its discretion, including as required to comply with any applicable law or regulation and Rule 10D-1. Any such amendment will be binding on all affected individuals.
Successors
This Policy shall be binding and enforceable against all the applicable Executive Officers, their beneficiaries, heirs, executors, administrators, and other legal representatives.
Page 3 of 3
Exhibit 97.2

February 18, 2019
Compensation Recoupment Policy
If, in the sole discretion of the Human Resources and Compensation Committee (“Committee”) of the Board of Directors based on an investigation conducted by the Business Integrity group in accordance with the C-2 Investigations & Speaking Up Policy, there has been Significant Misconduct (as defined below), then the Committee shall determine the extent, if any, to which the Incentive-Based Compensation of any Covered Executive involved in such misconduct should be recouped consistent with the provisions below.
a.For purposes of this policy, the following definitions shall be used:
i.“Covered Executive” means any Mondelēz International (“Company”) employee at Salary Band G and above.
ii.“Executive Officer” means any executives of the Company subject to the reporting requirements of Section 16 of the Securities Exchange Act of 1934, as amended, as may be determined by the Company’s Board of Directors.
iii.“Incentive-Based Compensation” means incentive compensation granted or paid during the last three years including, but not limited to, annual performance bonuses (including any amounts deferred) and long-term incentive grants.
iv.“Recoupment” means the recapture, recovery, cancellation or forfeiture of compensation to, or similar actions regarding, a Covered Executive, whether or not such compensation already has been paid or has vested.
v.“Significant Misconduct” means conduct resulting in a violation of:
•the Company’s Code of Conduct or Compliance Policy that causes significant financial or reputational harm to the Company, or
•a legal requirement relating to the manufacturing, sales or marketing of the Company’s products that causes significant financial or reputational harm to the Company
b.This policy applies to (i) any Covered Executive who was directly engaged in the Significant Misconduct, (ii) any Covered Executive who supervised a subordinate employee that engaged in the Significant Misconduct at issue, whose misconduct does not constitute an isolated occurrence and which the Covered Executive knew or should have known
1 | ||
February 18, 2019
was occurring, provided that the Incentive-Based Compensation of any Covered Executive will not be impacted if such employee was not involved in the misconduct at issue or was not responsible for the supervision of an employee involved in the misconduct at issue, and (iii) all Covered Executives to the extent that a financial restatement is required due to incorrect filings based on a violation of the Company’s Code of Conduct or Compliance Policy that resulted in a financial benefit to Covered Executives through the incentive compensation plans.
c.The determination by the Committee of whether to recoup Incentive-Based Compensation may be influenced by a variety of factors, including, but not limited to, (i) whether the underlying conduct was an isolated occurrence, (ii) feasibility and cost of implementation, (iii) legal and compliance factors, and (iv) whether other disciplinary actions against the Covered Executive have been taken.
d.If the Committee determines that it is appropriate to recoup Incentive-Based Compensation from a Covered Executive under this policy, the Committee shall decide on
(i) the amount of Incentive-Based Compensation provided to the Covered Executive that is subject to recoupment and (ii) the method of recoupment, including whether to seek the return of Incentive-Based Compensation already paid or to withhold or otherwise recoup (totally or partially) compensation that has not vested or has not been paid.
e.The Committee may delegate to a management committee (comprising HR, Legal, and Business Integrity) the administration of this policy with respect to Covered Executives who are not Executive Officers of the Company. In the event of such delegation, the management committee shall report to the Committee on any occurrences where it would be appropriate for the Committee to determine whether the policy has been triggered. Management shall also provide a report to the Committee, at least annually, describing any recoupment determinations made under this policy.
f.The Committee shall retain oversight responsibility for this policy.
g.The Committee shall report to the full Board on any recoupment determination made with respect to an Executive Officer of the Company.
h.Nothing in this policy is designed or intended to: (i) limit or restrict the Company or the Board of Directors from taking any disciplinary or legal action they deem appropriate; or (ii) conflict with any applicable laws or regulations.
i.Decisions made pursuant to this policy may be made in conjunction with, or separate and apart from, other Company recoupment programs.
j.This policy only applies to Incentive-Based Compensation granted or paid after the adoption of the policy.
2 | ||